
Colour Stock & Reorder Report
Tutorial 9.12: Colour Stock & Reorder Report
Introduction
The Colour Stock & Reorder Report is your colour-bar order sheet. It answers the question whoever runs the colour bar asks every week: "what do I need to order?" It lists your gram-tracked colour products — bases, developers, lighteners and additives — grouped the way a wholesaler order is structured, showing live stock on hand, how many full tubes that equals, the stock value, how fast each shade is being used, and a derived days to stockout so the most urgent shades sit at the top.
This is an operations report, not a margin review. It deliberately shows no revenue or profit — that's the Colour Bar Performance report. This report's job is to stop you running out of 7/43 mid-appointment and to make the weekly supplier order quick to assemble.
Who this is for: Owner, Admin, Manager — in practice, often the colourist running the bar.
What you'll learn:
- Open the report and read the four summary cards
- Read the reorder worklist (stock, full tubes, value, usage velocity, days to stockout)
- Use the runtime low-stock threshold to flag low and out-of-stock shades
- Filter by brand, product line, role and status
- Export the supplier-order CSV
- Understand what "days left is approximate" means and what the report does and doesn't cover
Time to complete: 10-15 minutes
Prerequisites
- Logged in as Owner, Admin, or Manager
- Gram-tracked colour products set up with brand, product line, tube size and stock (see the Colour Bar setup tutorials)
- Some colour usage recorded (from finalised colour formulas) so the report can calculate usage velocity
- For exporting: Owner or Admin role
What This Report Covers (and What It Doesn't)
- It covers gram-tracked colour only. Bases, developers, lighteners and additives that are measured in grams. Retail products and anything counted in units or millilitres are not shown — this is the colour-bar order sheet, not a retail inventory list.
- It does not show margin or revenue. For "is the colour bar profitable?", use the Colour Bar Performance report.
- Stock figures are live, right now. The stock on hand, full tubes and stock value are point-in-time as of this moment. The date range you pick only affects the usage velocity and days to stockout calculations, not the stock itself.
Step-by-Step Instructions
Step 1: Open the Report
- Click Reports in the sidebar
- Under Inventory Reports, click Colour Stock & Reorder
- The report opens using the last 30 days as the usage-velocity window
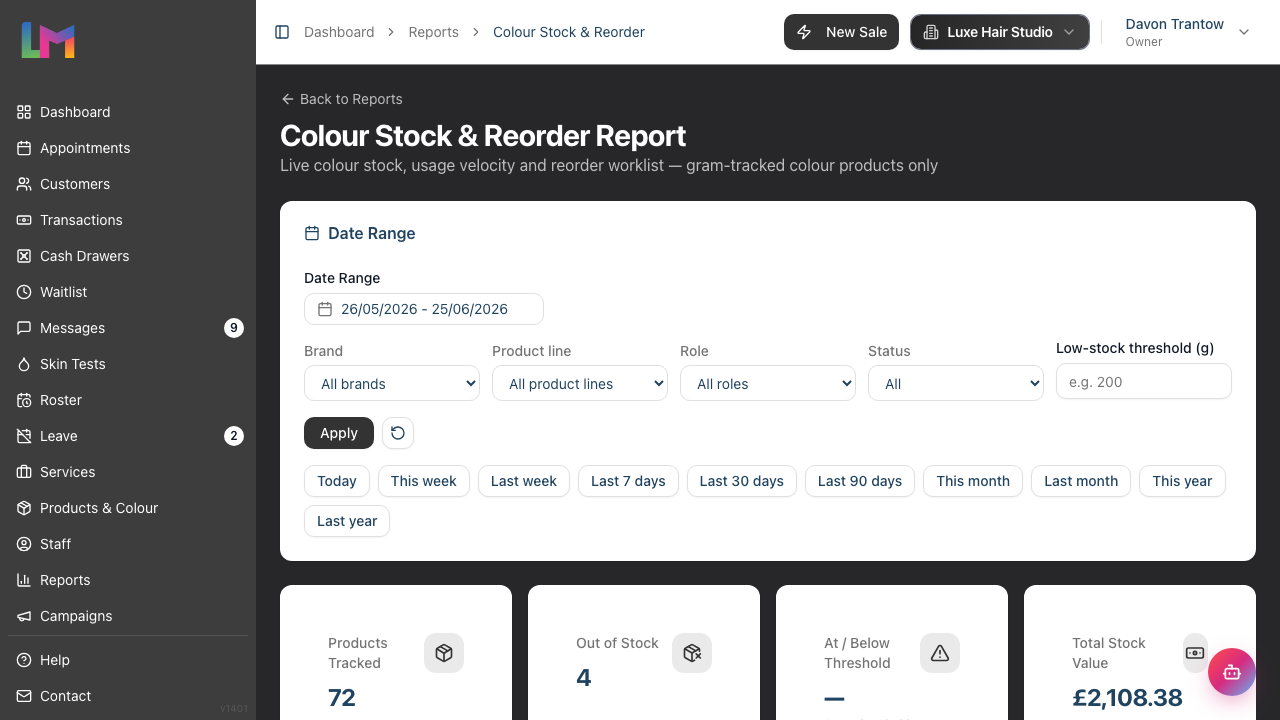
The page header reads "Colour Stock & Reorder Report" with the subtitle "Live colour stock, usage velocity and reorder worklist — gram-tracked colour products only".
Step 2: Read the Summary Cards
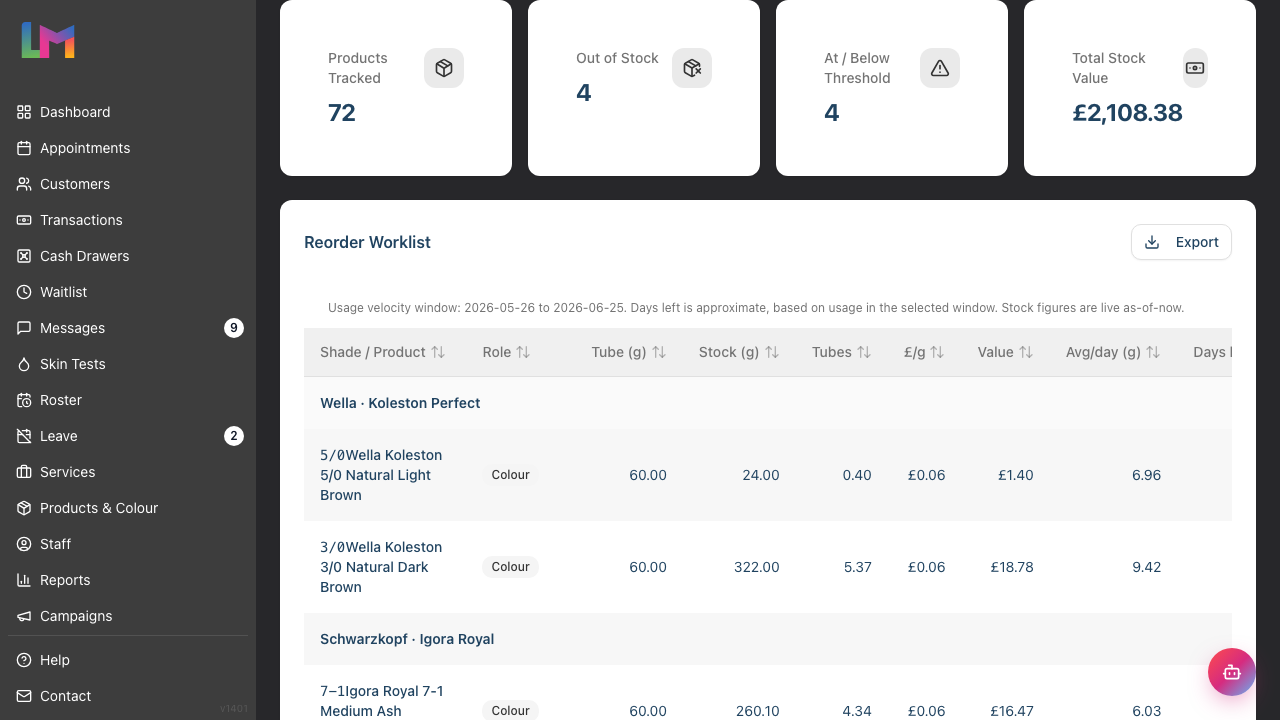
Four summary cards sit at the top, covering the filtered set of products:
| Card | What It Shows |
|---|---|
| Products Tracked | How many colour products are in the current view |
| Out of Stock | How many have zero stock on hand |
| At / Below Threshold | How many are at or below your low-stock threshold (shows — until you set a threshold) |
| Total Stock Value | The combined value of the colour stock on hand |
Step 3: Set a Low-Stock Threshold
This is the most important control on the report, so it's worth understanding why it works the way it does.
Luminate does not store a per-shade low-stock level for gram-tracked colour. Rather than show you a "low stock" column that's always blank, the report lets you type a threshold in grams at the moment you run it:
- In the Date Range filter card, enter a value in the Low-stock threshold (g) field — for example
200 - Click Apply
Once a threshold is set, the report:
- Flags every product at or below it with a Low badge (out-of-stock products show Out instead)
- Fills in the At / Below Threshold summary card
- Uses the threshold as the reorder target to suggest how many tubes to order (see Step 5)
Without a threshold, products are only ever OK or Out — nothing is marked Low — and no tube suggestion is calculated. The report still works as a live stock, value and velocity list; you just won't get the low-stock flagging until you type a number. Think of it as "show me everything at or below 200g" — instant, with zero setup.
Step 4: Read the Reorder Worklist
The main table is the order sheet. When sorted the default way it's grouped by brand → product line, with a heading row above each group, the way a wholesaler order reads.
| Column | Description |
|---|---|
| Shade / Product | The shade code and product name |
| Role | A badge: Colour, Developer, Lightener, or Additive |
| Tube (g) | The tube size in grams (shows — if not set) |
| Stock (g) | Live stock on hand in grams |
| Tubes | Stock expressed as full tubes — the unit you actually buy (shows — if no tube size) |
| £/g | Cost per gram (shows — if no cost recorded) |
| Value | The value of the stock on hand (shows — if no cost) |
| Avg/day (g) | Average grams used per day across the selected window |
| Days left | Derived days to stockout — approximate (shows — when there's no recent usage) |
| Status | Out (red) or Low (amber); nothing for items that are OK |
| Order (tubes) | Suggested tubes to order to reach your threshold (shows — when not applicable) |
Sorting: Click any column header to sort. The default sort is Days left, most urgent first, with products that have no recent usage pushed to the bottom. The table is paginated at 25 rows per page.
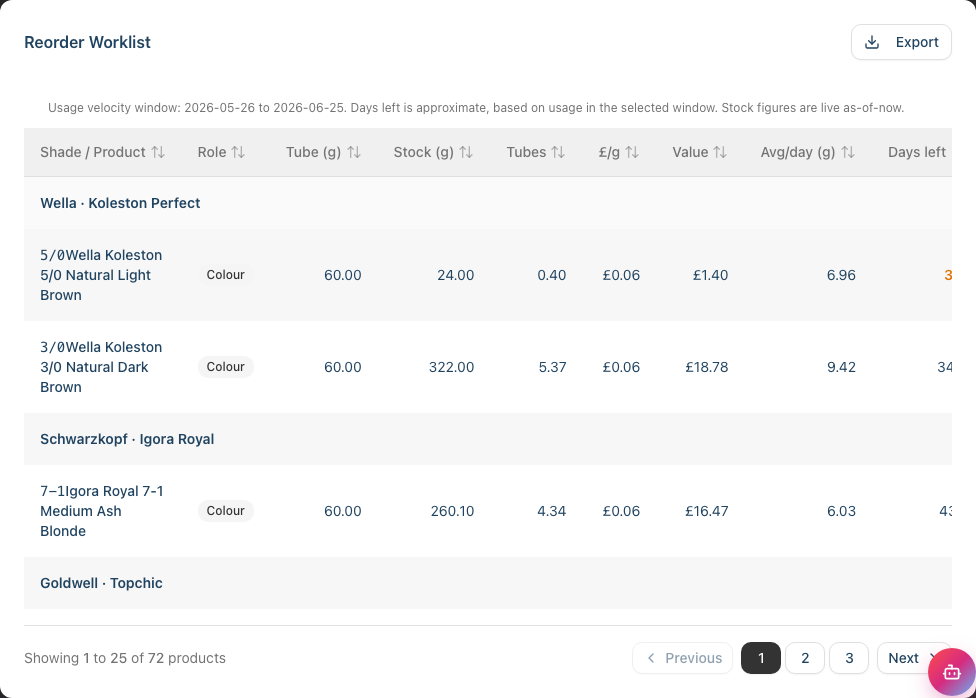
A caption under the table title states the velocity window in your salon's local dates and reminds you that "Days left is approximate, based on usage in the selected window."
Step 5: Use the Suggested Tubes to Order
When you've set a threshold, the Order (tubes) column suggests how many full tubes to buy to bring each shade up to that level. It rounds up to whole tubes (you can't buy half a tube), and it only suggests an order where the shade is below the threshold and has a tube size set. Where there's no tube size, the column shows — because the gap can't be expressed in tubes.
This turns the worklist into a buy list: set your threshold, sort by Days left, and read down the Order column to assemble your order.
Step 6: Filter the List
Use the filters in the Date Range filter card to narrow the view:
- Brand — show one brand's colour only
- Product line — narrows to a line within the chosen brand
- Role — Colour, Developer, Lightener or Additive
- Status — All, Low stock, or Out of stock
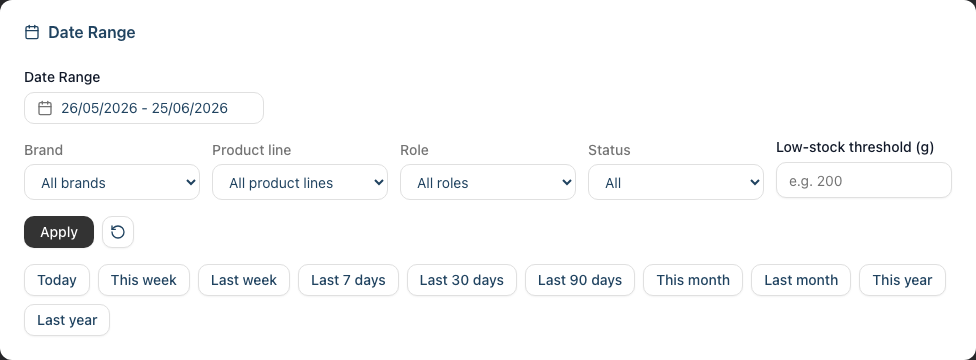
Note: the Low stock status filter needs a threshold set — without one, it returns nothing, with a hint to set a threshold. Out of stock works with or without a threshold (it just shows everything at zero stock).
Step 7: Adjust the Usage-Velocity Window
The date range controls the period the Avg/day and Days left figures are calculated from:
- Use the start date and end date pickers (or a preset)
- Click Apply
A longer window smooths out busy and quiet days; a shorter window reflects recent demand more sharply. Remember this only changes the velocity maths — the stock figures are always live.
Step 8: Export the Supplier Order Sheet
To export the worklist for ordering:
- Set your filters and threshold
- In the worklist card, click the Export button (top right of the table card)
- Choose Export as CSV or Export as PDF
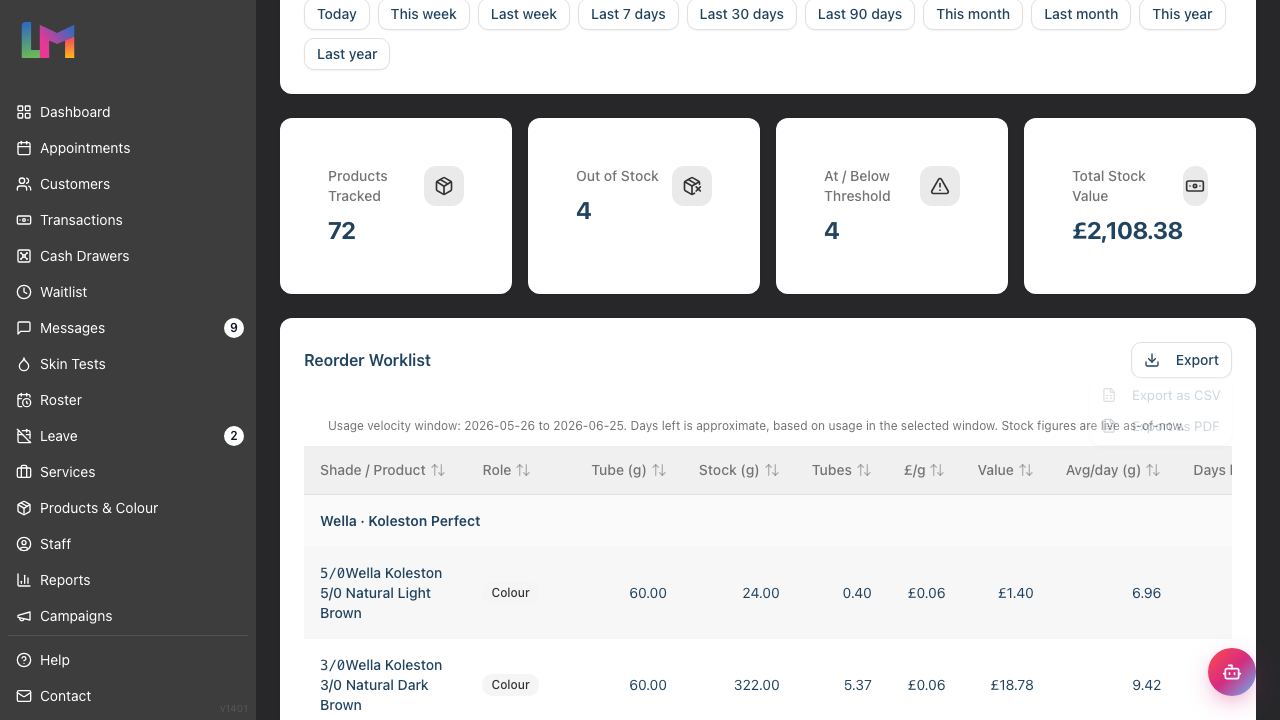
The CSV downloads with a name like colour-stock-2026-06-01-to-2026-06-30.csv and is framed as a supplier order sheet — Brand, Product Line, Shade, Product, Role, Tube Size, Stock On Hand, Current Tubes, Avg Daily Usage, Days To Stockout, Status, and Suggested Tubes To Order. The rows follow whatever sort you have on screen, so the exported sheet reads exactly like the worklist. Cost and value columns are intentionally left off the supplier sheet — that's margin territory for the Colour Bar Performance report.
Note: Exporting is available to Owners and Admins only. Managers can read the report on screen but cannot download it — ask an Owner or Admin if you need the file.
Understanding How the Numbers Are Calculated
Full tubes = stock on hand ÷ tube size. It's how a salon actually buys colour, so the worklist leads with it.
Stock value = stock on hand × cost per gram. Where a product has no cost recorded, the value shows — and contributes nothing to the Total Stock Value card (so the count stays honest rather than guessing).
Average daily usage = the total grams used across the selected window, divided by the number of days in that window. Only genuine colour usage counts toward velocity — waste and other adjustments are excluded.
Days to stockout = stock on hand ÷ average daily usage. It's a simple recent-velocity estimate, not a forecast — that's why it's labelled approximate. A shade with stock but no recent usage shows — for days left, which legitimately means "not urgent".
Status is derived live from your threshold: Out when stock is zero, Low when stock is at or below your threshold (and above zero), otherwise OK.
Common Pitfalls
"Nothing is marked Low"
You haven't set a threshold yet, or your stock is genuinely above it. Enter a value in Low-stock threshold (g) and click Apply — the Low badges and the At / Below Threshold card only populate once a threshold is in place.
"Days left shows a dash"
That product has had no recorded usage in the selected window, so there's no velocity to project from. A full shelf with no recent use is correctly "not urgent". Widen the date range if you want a longer-run average.
"A retail product isn't showing"
By design — this report only includes gram-tracked colour. Retail stock, and anything tracked in units or millilitres, is excluded.
"The stock figure doesn't match a past date"
Stock is shown live, as of right now. The date range only affects usage velocity and days to stockout, not the stock on hand.
"Value or £/g shows a dash"
That product has no cost (or no tube size) recorded, so cost per gram and value can't be calculated. Add the cost on the product to see these figures.
"Days left seems off"
It's an approximation based on recent usage in the window you selected, not a demand forecast. A quiet or unusually busy window will skew it — try a longer window for a steadier average.
Tips and Best Practices
- Set a threshold that matches your delivery cadence — If your wholesaler delivers weekly, set the threshold to roughly a week's stock so the worklist flags anything that won't last until the next drop
- Sort by Days left before ordering — The default sort already puts the most urgent shades at the top; read down and fill the Order column
- Export the CSV as your order sheet — Take it to the wholesaler or paste it into an order; the columns are arranged for transcription
- Filter by brand when ordering from one supplier — Narrow to the brand you're ordering, set the threshold, and export just that brand's worklist
- Re-check after a big colour day — Stock is live, so a quick look after a busy day catches shades that dropped below threshold
Looking Ahead: One-Click Supplier Reordering
Today the threshold is something you type each time you run the report, and the suggested order is expressed in tubes against that threshold. A future enhancement is planned to make reordering more automatic — storing a per-shade low-stock level so you don't re-enter it, and capturing supplier details and pack sizes so the report can produce a supplier-ready order with lead times factored in. Until that's built, treat the suggested order as a helpful starting point rather than a finished, supplier-addressed purchase order — set expectations accordingly.
Related Tutorials
- Tutorial 8.6: Colour Bar Performance Report — Colour-bar revenue, cost and margin (the profit side of the colour bar)
- Tutorial 9.2: Running Revenue Reports — Salon-wide revenue
- Tutorial 9.1: Understanding Your Dashboard — Performance at a glance
Frequently Asked Questions
Why do I have to type a threshold every time?
Luminate doesn't yet store a per-shade low-stock level for gram-tracked colour, so the report asks for a salon-wide threshold at the moment you run it. This means you get useful low-stock flagging immediately with no setup. A future enhancement will let you store per-shade levels.
Why doesn't this report show profit or margin?
This is the operations order sheet — it's about what to buy, not how much you make. For margin and revenue on colour, use the Colour Bar Performance report.
Does the date range change my stock figures?
No. Stock on hand, full tubes and stock value are always live. The date range only sets the window for average daily usage and days to stockout.
Why are some products missing?
The report only includes active, gram-tracked colour products. Retail stock and anything tracked in units or millilitres is excluded by design.
Is "Days left" a forecast?
No — it's an approximation based on recent usage in the window you chose, divided into your current stock. It's a quick urgency signal, not a demand forecast.
Can the report email an order to my supplier?
Not yet. The CSV export gives you a supplier-style order sheet to work from, but Luminate doesn't store supplier contacts or pack sizes for automatic ordering. That's a planned future enhancement.
Can colourists see this report?
Currently the report is available to Owners, Admins, and Managers. A dedicated colourist self-view is not yet available.
Last Updated: June 2026