Customer Analytics - Top Customers and Retention
Tutorial 9.4: Customer Analytics - Top Customers and Retention
Introduction
Know your best customers. This guide shows you how to run the top customers report, see who spends the most, track visit frequency, calculate average ticket size, monitor customer retention, and identify VIPs worth extra attention. Use this data to reward loyal customers and improve retention.
Who this is for: Salon owners, admins, and managers who want to understand their customer base and improve retention.
What you'll learn:
- Running the top customers report
- Understanding customer value metrics
- Identifying VIP customers
- Tracking visit frequency and retention
- Exporting customer data for marketing
Time to complete: 10-15 minutes
Prerequisites
Before you begin, make sure you have:
- A Luminate account with Owner, Admin, or Manager role
- Customers in your database with transaction history
- For exporting: Owner or Admin role
Step-by-Step Instructions
Step 1: Navigate to the Top Customers Report
- Log in to Luminate
- Click Reports in the sidebar menu
- Under the Customer Reports category, click Top Customers
- The report loads showing your highest-value customers
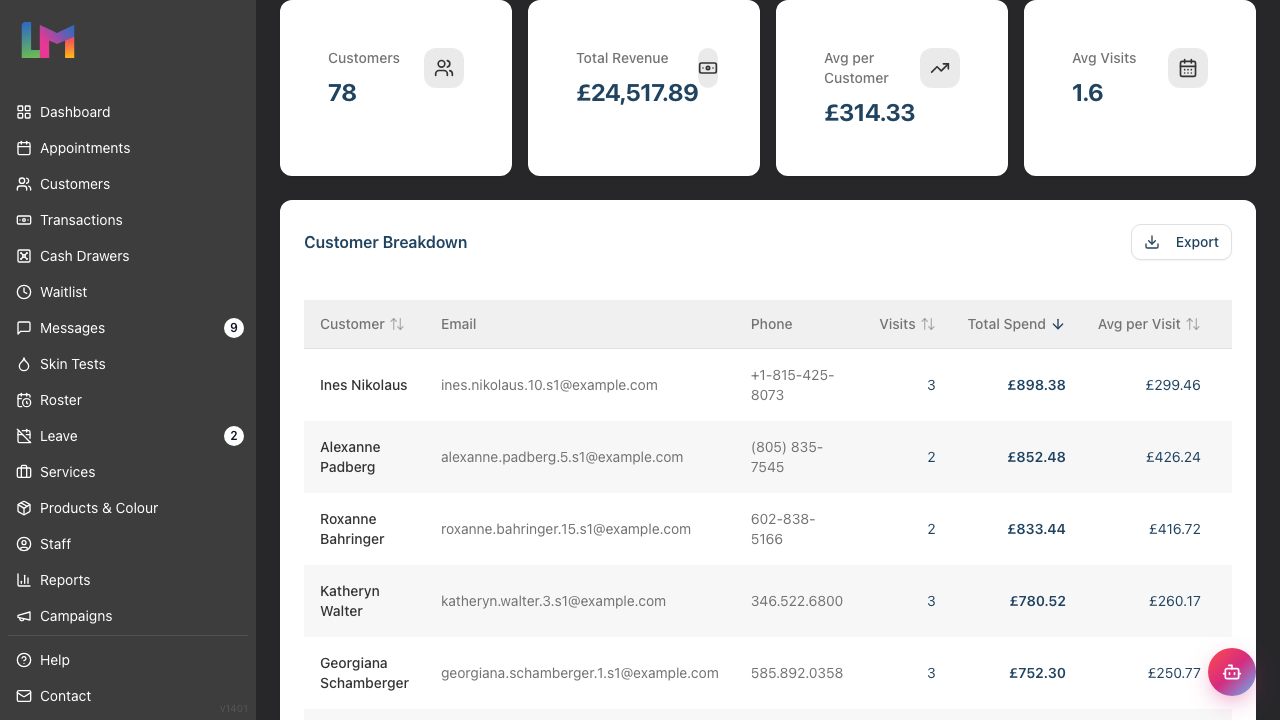
Step 2: Understanding the Summary Cards
At the top of the report, you'll see summary metrics:
| Card | What It Shows |
|---|---|
| Customers | Number of unique customers with transactions in the selected period |
| Total Revenue | Combined spending from all customers |
| Avg per Customer | Average revenue per customer (Total Revenue ÷ Customers) |
| Avg Visits | Average number of transactions per customer |
These headline figures help you understand overall customer engagement.
Step 3: Using the Date Range Filter
Control which period the report analyses:
Preset Options:
- Today - Current day only
- This week - Current Monday to Sunday
- Last week - Previous Monday to Sunday
- Last 7 days - Rolling 7-day period
- Last 30 days - Rolling 30-day period
- Last 90 days - Rolling 90-day period
- This month - Current calendar month
- Last month - Previous calendar month
- This year - Year to date
- Last year - Previous full year
Custom Date Range:
- Click the date range picker
- Select your start and end dates
- Click Apply to update the report
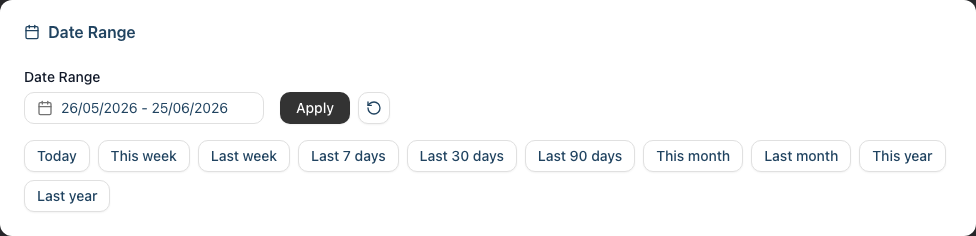
Tip: Use longer periods (90 days, yearly) for meaningful customer value analysis. Monthly views can be misleading for customers who visit bi-monthly.
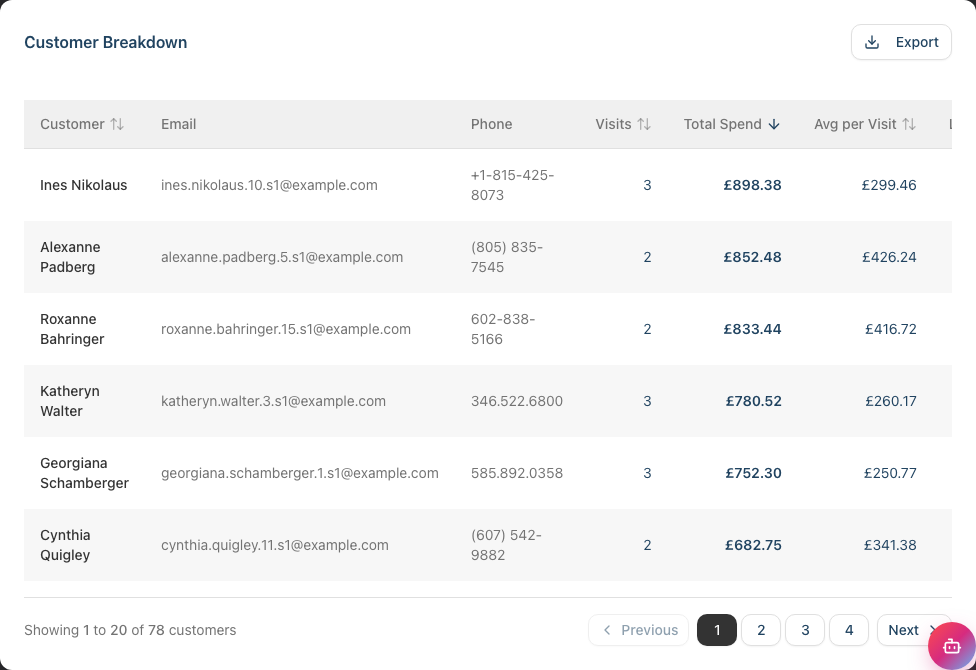
Step 4: Reading the Top Customers Table
The main table, headed Customer Breakdown, ranks customers by total spend:
| Column | Description |
|---|---|
| Customer | The customer's name (clickable link to their profile) |
| Customer's email address | |
| Phone | Customer's phone number |
| Visits | Number of completed transactions in the period |
| Total Spend | Total revenue from this customer |
| Avg per Visit | Average spend per transaction |
| Last Visit | Date of most recent completed transaction |
Default sorting: Customers are ranked by Total Spend (highest first).
Sortable columns: Click these column headers to sort by:
- Customer (alphabetical)
- Visits (most frequent customers)
- Total Spend (highest spenders)
- Avg per Visit (highest average transaction value)
- Last Visit (most recently active)
The Email and Phone columns are shown for reference but are not sortable.
Step 5: Identifying VIP Customers
Your VIP customers are typically those who:
- Spend the most - Top 10-20 customers by total revenue
- Visit frequently - Regular transactions (monthly or more)
- High average per visit - Spend more per transaction than average
Using the report to find VIPs:
- Note the top 10 customers by total spend
- Sort by visits to find your most frequent customers
- Cross-reference both lists - customers appearing in both are true VIPs
What to do with VIP information:
- Prioritise their booking requests
- Remember their preferences
- Consider loyalty rewards or special offers
- Send personalised thank-you messages
Step 6: Understanding Average per Visit
Average per visit (spend per transaction) reveals customer behaviour:
| Avg per Visit | What It Might Mean |
|---|---|
| High | Customer books premium services or multiple services |
| Low | Customer books basic services only |
| Increasing | Customer is upgrading or adding services over time |
| Decreasing | Customer may be cutting back or switching services |
Why this matters: A customer with 2 transactions at £150 each may be more valuable long-term than one with 10 transactions at £25 each - they're booking higher-value services.
Step 7: Tracking Visit Frequency
Visit frequency indicates customer loyalty:
| Frequency | Interpretation |
|---|---|
| Weekly | Very loyal, possibly regular maintenance service |
| Bi-weekly | Strong loyalty, regular client |
| Monthly | Typical for many salon services |
| Quarterly | Occasional client, opportunity to increase visits |
| Yearly | Rare visitor, risk of lapsing |
Finding at-risk customers:
- Sort by "Last Visit" (click twice to sort oldest first)
- Look for customers who haven't visited in 6+ weeks
- Consider reaching out with a reminder or offer
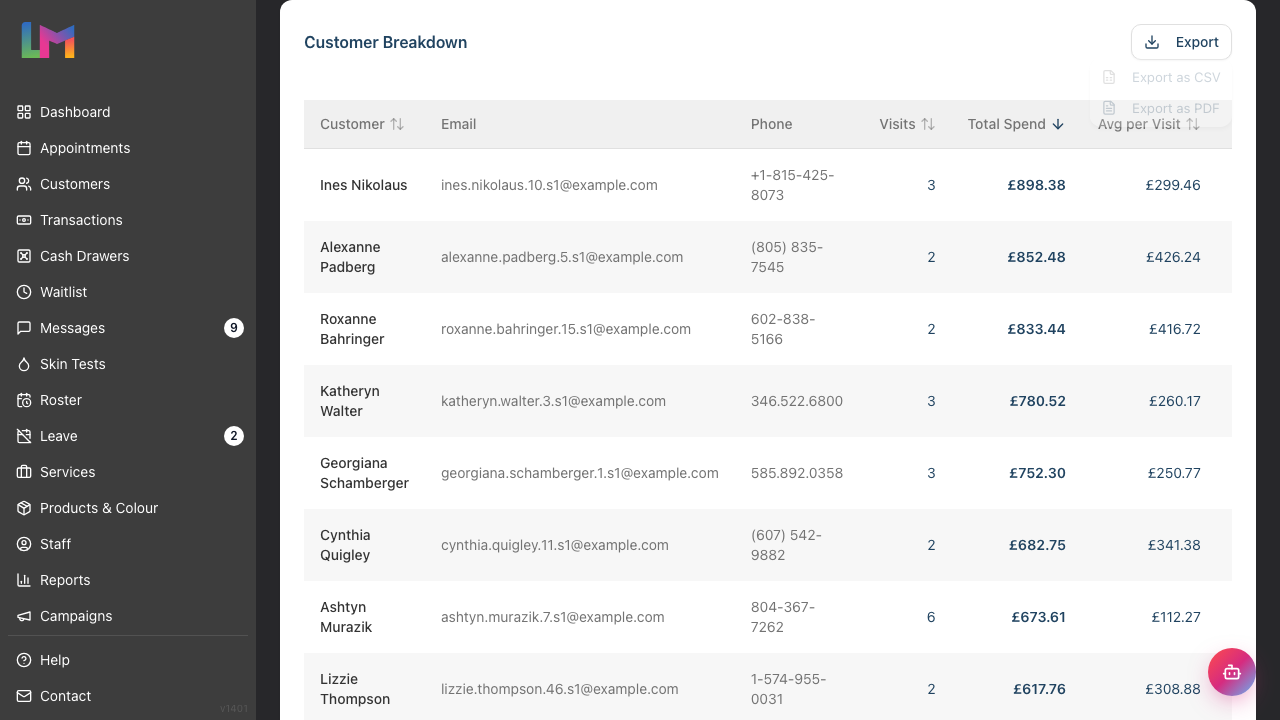
Step 8: Exporting Customer Data
To export your top customers list:
- Set your desired date range
- Click Apply to load the data
- Click the Export button in the Customer Breakdown card header
- Choose Export as CSV or Export as PDF from the dropdown menu
- The file downloads with all customer data
Export includes:
- Customer name, email, and phone
- Total Spend and visit count
- Average per visit
- Last Visit and First Visit dates
Uses for exported data:
- Marketing campaigns targeting top spenders
- Loyalty programme analysis
- Customer segmentation for targeted offers
- Integration with email marketing tools
Note: Only Owners and Admins can export. Ensure you comply with GDPR when using customer data for marketing (see Tutorial 11.2).
Common Pitfalls
"A new customer appears in my top 10 after one big visit"
Short date ranges can skew results. A customer who spent £500 once will rank above a loyal customer who spent £400 over 10 visits in that month. Use longer periods (90 days, yearly) for true customer value.
"I can't find a customer I know spends a lot"
The report only shows completed transactions from the selected date range. If your best customer hasn't visited recently, extend your date range or check their individual customer profile for full history.
"The visit count seems wrong for a customer"
Visits count finalised transactions, not appointments. A transaction counts once it is completed (and it still counts if it was later refunded — it was a genuine visit). If a customer has two separate transactions on the same day, that counts as two visits. Draft, cancelled, or incomplete transactions don't count.
"I don't see contact information for some customers"
Some customers may have incomplete profiles (e.g., no email or phone). This is a good opportunity to update their records at their next visit.
"New customers dominate my list"
New customers often have high initial spend (trying multiple services). Over time, established customers typically provide more total value. Use 12-month periods for balanced analysis.
Tips and Best Practices
- Review regularly - Customer value metrics are most meaningful over longer periods (90 days or yearly)
- Identify your top 20 - These customers likely provide a disproportionate share of revenue (the 80/20 rule)
- Watch for declining VIPs - If a top customer's visits or spend drops, reach out personally
- Use Avg per Visit for upselling insights - Low average customers might be good candidates for service upgrades
- Combine with rebooking data - Customers who rebook before leaving are more valuable long-term
- Segment by visit frequency - Create different engagement strategies for weekly vs quarterly customers
Related Tutorials
- Tutorial 3.2: Understanding Customer History and Analytics - Deep dive into individual customer data
- Tutorial 9.1: Understanding Your Dashboard - See rebooking rates at a glance
- Tutorial 10.2: Birthday Notifications and Customer Engagement - Automated customer outreach
- Tutorial 11.2: GDPR Compliance - Using customer data responsibly
Frequently Asked Questions
How is "Total Spend" calculated?
Total Spend is the sum of the customer's finalised transaction totals within the date range. It includes services, products, and any other items on the transaction. Any deposit already paid towards a booking is netted off, so the figure reflects the actual revenue taken in the period. Refunded transactions are included at their original value; draft, cancelled, or incomplete transactions are excluded.
What counts as a "visit"?
A visit is a finalised transaction (completed, or completed and later refunded). If a customer has two separate transactions on the same day, that counts as two visits. This differs from appointment counts.
Can I see which services my top customers book?
The Top Customers report shows overall figures. For service details, click on a customer name to view their profile, which shows their complete booking and transaction history.
Does this report show new customers vs returning?
Not directly. For new customer analysis, compare short date ranges and look for customers with only 1 visit. Customers with multiple visits in the period are returning customers.
Can I filter by specific services or products?
The report shows overall customer value. For service-specific analysis, export the data and filter in a spreadsheet, or use the individual customer profiles.
How do I track customer retention rates?
Compare the number of customers who visited in one period and returned in the next. For example: customers who visited in Q1 and also visited in Q2. This requires exporting data from both periods and cross-referencing.
Is this data real-time?
Yes, the report shows current data based on completed transactions. There's no delay - as soon as a transaction is completed, it's reflected in the report.
Last Updated: June 2026