Tracking Staff Performance and Commission
Tutorial 4.4: Tracking Staff Performance and Commission
Introduction
Understanding how your team performs helps you make informed business decisions, run fair payroll, and identify coaching opportunities. This tutorial shows you how to use the Staff Performance report to track revenue, tips, and commission for each team member.
Who this is for: Owner, Admin, Manager What you'll learn:
- Access the Staff Performance report
- Understand the metrics displayed
- Filter and sort performance data
- Export reports for payroll
- Interpret commission calculations
Time to complete: 10 minutes
Prerequisites
- Logged in as Owner, Admin, or Manager
- Some completed transactions in the system
- Staff members configured with commission rates (see Tutorial 4.1)
Step-by-Step Instructions
Step 1: Access the Staff Performance Report
- Click Reports in the sidebar
- Find Staff Reports section
- Click Staff Performance
The report opens showing performance data for your team.
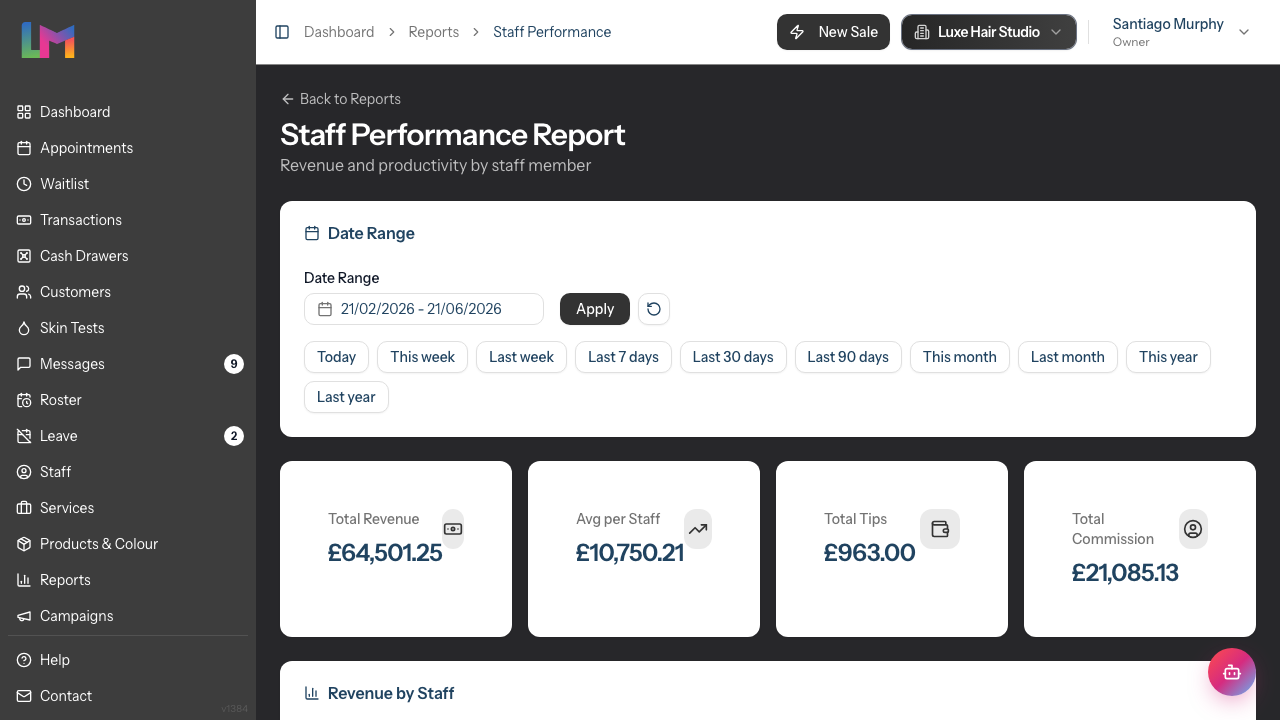
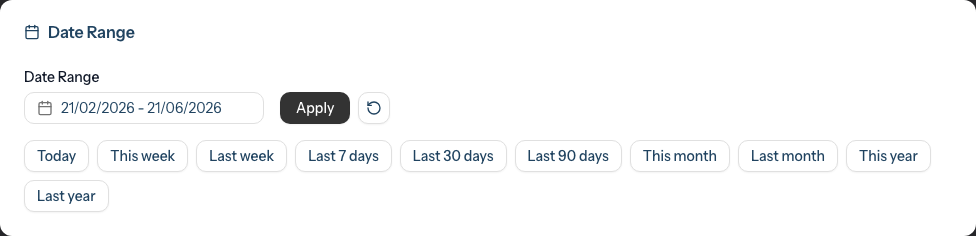
Step 2: Understand the Date Range Filter
The report defaults to the last 30 days. To adjust:
- Click the Date Range field to open the date picker
- Select your start and end dates
- Click Apply to update the report
- Click the reset icon (circular arrow) to return to the default date range
Quick date presets: Below the date range, you'll find preset buttons for common periods:
- Today, This week, Last week, Last 7 days
- Last 30 days, Last 90 days
- This month, Last month, This year, Last year
Common date ranges:
- Current month for ongoing tracking
- Previous month for payroll calculations
- Custom range for specific periods
Step 3: Read the Summary Cards
At the top of the report, four summary cards display:
| Card | What It Shows |
|---|---|
| Total Revenue | Combined revenue from all staff in the period |
| Avg per Staff | Average revenue per staff member (staff with revenue only) |
| Total Tips | Combined tips received by all staff |
| Total Commission | Combined commission earned by all staff |
These give you a quick snapshot of team performance.
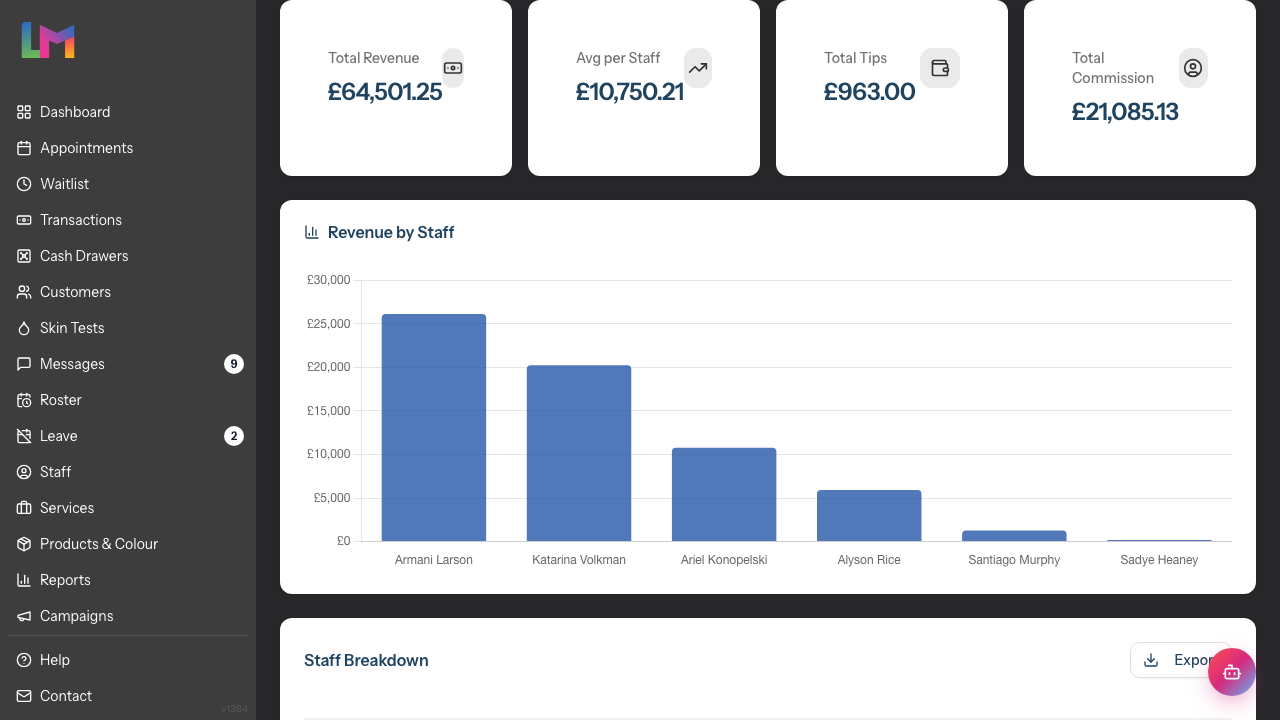
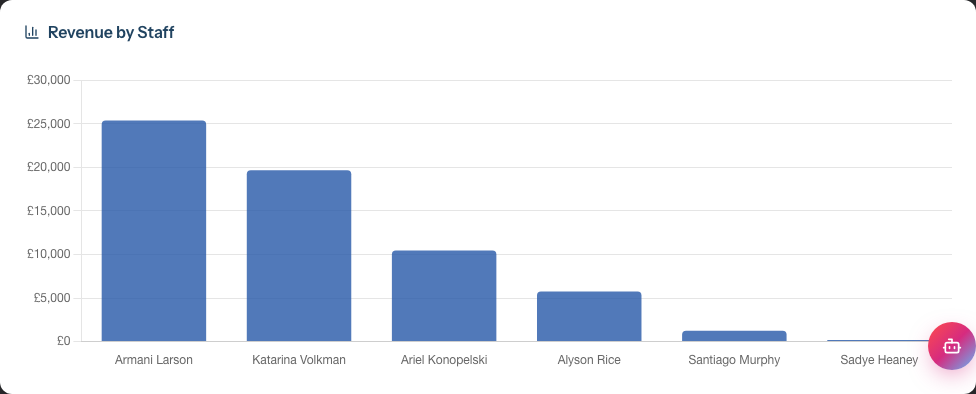
Step 4: View the Performance Chart
Below the summary cards, a bar chart displays Revenue by Staff:
- Each bar represents one staff member
- Bar height shows total revenue
- Hover over bars to see exact values
- Staff are ordered by the current sort selection
The chart provides a visual comparison of performance across your team.
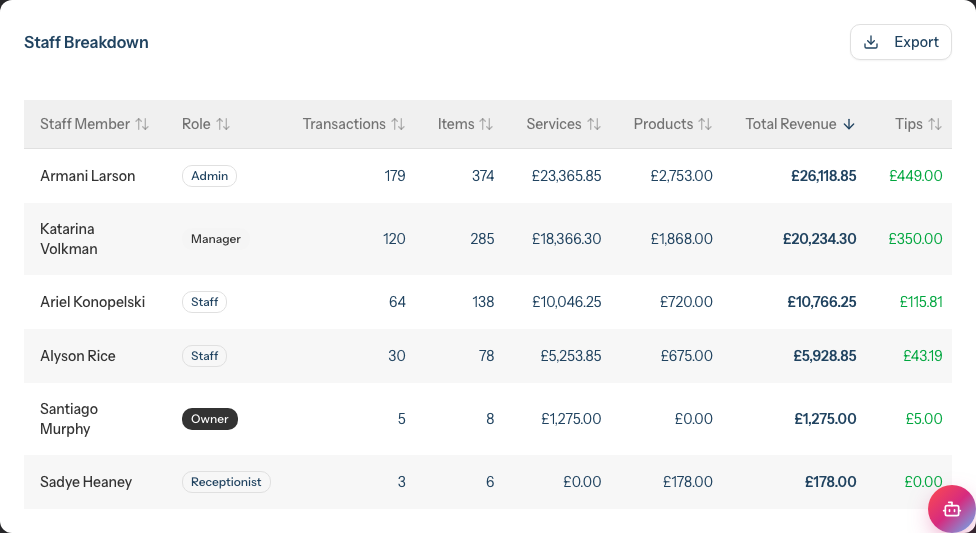
Step 5: Read the Data Table
The detailed table, titled Staff Breakdown, shows:
| Column | Description |
|---|---|
| Staff Member | Name (clickable link to profile) |
| Role | Staff member's role (Owner, Admin, Manager, Staff, Receptionist) |
| Transactions | Number of completed transactions |
| Items | Total service and product items sold |
| Services | Revenue from services only |
| Products | Revenue from product sales only |
| Total Revenue | Combined services + products |
| Tips | Tips received (attributed proportionally) |
| Commission | Commission earned on items |
Step 6: Sort the Report
Click a sortable column header to reorder the data:
- Click once to sort ascending (A-Z, low to high)
- Click again to sort descending (Z-A, high to low)
- An arrow indicates the current sort direction
You can sort by Staff Member, Transactions, Items, Services, Products, and Total Revenue. The Role, Tips, and Commission columns are display-only — clicking their headers returns the table to the default Total Revenue (highest first) order.
Useful sorts:
- Total Revenue descending - See top performers first
- Transactions descending - See who's busiest
- Services descending - Compare service income across the team
- Staff Member ascending - Alphabetical for payroll
Step 7: Understand Commission Calculations
Commission is calculated per transaction item:
Item Commission = Item Subtotal × Commission Rate ÷ 100
Example:
- Haircut: £45 at 40% commission = £18 commission
- Product: £15 at 10% commission = £1.50 commission
- Total transaction commission = £19.50
Commission rate sources:
- Service-specific commission rate (if set on the service)
- Staff member's default commission rate (fallback)
- Zero if neither is configured
Step 8: Understand Tip Attribution
Tips are attributed to staff based on their service revenue contribution:
Staff Tips = Transaction Tip × (Staff Service Revenue ÷ Total Transaction Service Revenue)
Example multi-staff transaction:
- Transaction tip: £10
- Sarah's services: £80 (80% of service revenue)
- Emma's services: £20 (20% of service revenue)
- Sarah receives: £8 tip
- Emma receives: £2 tip
Step 9: Export the Report
To export for payroll or records:
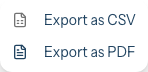
- Click Export in the table header
- Choose format:
- Export as CSV - For spreadsheet software (Excel, Google Sheets)
- Export as PDF - For printing or archiving
- The file downloads automatically
CSV export includes: Staff, Role, Transactions, Items, Service Revenue, Product Revenue, Total Revenue, Tips, Commission
When to export:
- End of pay period for payroll calculations
- Monthly for records
- Quarterly for performance reviews
Step 10: View Individual Staff Details
To see more detail for a specific staff member:
- Click the staff member's name in the table
- Their profile opens
- Review their settings, schedule, and transaction history
The profile shows their configured commission rate and compensation type.
Other Staff Reports
Beyond the Staff Performance report, Luminate offers:
Hours Worked Report
Navigate to Reports → Hours Worked for:
- Rostered hours by staff member
- Scheduled hours vs working hours (minus breaks)
- Shift counts per staff member
- Export for payroll and pension reporting
- See Tutorial 4.5 for full details
Staff Commission Report
Navigate to Reports → Staff Commission for a single staff member's commission detail:
- Service vs product commission split
- Item-by-item breakdown of how commission was earned
- Tier progression for Salary + Commission staff
- Useful when a team member queries their commission figure
Payroll Report
Navigate to Reports → Payroll for:
- Monthly payroll calculations
- Hours worked (from roster)
- Commission earned
- Tips received
- Useful for processing staff payments
Leave Report
Navigate to Reports → Leave Report for:
- Leave allowances by staff member
- Days taken vs remaining
- Pending leave requests
- Breakdown by leave type
Common Pitfalls
"A staff member shows zero revenue"
Check:
- Are they assigned to transactions during the period?
- Is the date range correct?
- Are the transactions marked as completed?
"Commission doesn't match what I calculated"
Commission calculates on item subtotal, not total amount. Check:
- What commission rate is set on the service?
- Does the staff member have a fallback commission rate?
- Are discounts applied? (Commission calculates on discounted price)
"Tips seem wrong for multi-staff transactions"
Tips are split proportionally by service revenue. If one staff member did more services, they receive more of the tip. This is automatic and based on the actual service values.
"I can't see the report"
Only Owners, Admins, and Managers can access staff performance reports. Staff and Receptionists cannot view others' performance data.
"Export is missing data"
Ensure your date range captures all the transactions you need. The export only includes data from the currently filtered date range.
Tips and Best Practices
- Run reports consistently - Use the same pay period dates each time
- Export before payroll - Download CSV for your accounting system
- Compare periods - Track month-over-month trends
- Sort by different metrics - Revenue isn't the only measure of value
- Consider context - Part-time staff naturally have lower totals
- Keep records - Export and store monthly reports
- Review with staff - Share relevant metrics in one-on-ones
- Check commission setup - Verify rates are configured correctly before reviewing reports
Related Tutorials
- Tutorial 4.1: Adding New Staff Members - Setting commission rates
- Tutorial 4.3: Staff Levels and Experience Tiers - Level-based commission
- Tutorial 2.4: Processing Transactions - How commission is recorded
Frequently Asked Questions
Can staff see their own performance data?
Staff members can see their own transactions and appointments but cannot access the Staff Performance report, which compares all team members.
How is commission affected by discounts?
Commission is calculated on the discounted price (what the customer paid), not the original price. This is industry standard.
What if I need to correct a commission calculation?
Commission comes from transaction items. To correct, you'd need to edit the transaction item's commission rate or staff assignment, which may require admin access.
Are refunded transactions included?
It depends on the figure. The revenue columns (Services, Products, Total Revenue) and the Transactions and Items counts include both completed and refunded transactions. Tips and Commission are calculated from completed transactions only, so refunds never count towards them.
Can I see historical performance data?
Yes. Use the date range filter to view any past period. All transaction data is retained.
How do I track performance against targets?
Currently, Luminate shows actual performance. Compare exported data against your targets in a spreadsheet for goal tracking.
Does the report include cancelled appointments?
No. Only completed transactions with payments are included. Cancelled appointments don't appear.
Why does one staff member have Tips but another doesn't?
Tips are attributed based on service revenue on transactions where tips were recorded. Staff who only sold products or weren't on tipped transactions won't have tips.
Can I see daily breakdowns per staff?
The Staff Performance report shows totals for the selected period. For daily detail, use the Daily Revenue report and filter by staff, or review individual transactions.
How often should I review staff performance?
Weekly quick checks help spot issues early. Monthly detailed reviews suit most salons. Export monthly for payroll and quarterly for performance reviews.
Commission Tracking on the Dashboard (Staff View)
Staff members on commission-based pay (Commission Only or Salary + Commission) can track their commission directly from the Dashboard — no need to access reports.
What Commission Staff See
When a staff member's compensation type is set to commission-based, the Dashboard automatically shows:
Commission This Week card — appears in the top row alongside the next appointment and alerts. Shows:
- Total commission earned this week
- Percentage change vs last week
- Service vs product commission split
- Days remaining in the week
Commission Tracker panel — appears below the analytics or personal stats section. Includes:
- Daily trend chart showing commission earned each day for the selected period
- Breakdown of service vs product commission with visual bars
- Tier progress (Salary + Commission staff only) showing how revenue maps across commission tiers with progress bars
How It Works
- The Commission This Week card always shows the current week (Monday to Sunday), regardless of the period selector
- The Commission Tracker panel follows the period selector (Today, Week, Month, or custom range)
- For Commission Only staff, commission is calculated from the rates stored on each transaction
- For Salary + Commission staff with tiers, commission is calculated from cumulative service revenue across the configured tiers
Who Sees It
Any staff member with a commission-based compensation type sees these features, regardless of their role — Staff, Receptionist, Manager, or Admin. Staff on Hourly or Salary pay do not see commission features.
Last Updated: June 2026