
Understanding Your Dashboard
Introduction
The dashboard gives you a quick overview of your salon's performance. The top of the page is the Right Now section (today's real-time information), and below it a set of tabs splits the rest into Today's Appointments and Analytics (period-based performance metrics). Learn how to read the key metrics, switch between time periods, compare to previous periods, and understand the visual charts showing trends and staff performance.
Who this is for: All Luminate users. Owners, admins, and managers see the full dashboard with salon-wide analytics. Staff and receptionists see today's information and their personal performance metrics.
What you'll learn:
- Recognising the onboarding checklist (for new salons still being set up)
- Understanding the "Right Now" section with the next appointment and alerts
- Reading the quick stats bar
- Switching between the Today's Appointments and Analytics tabs
- Switching between time periods and navigating with period arrows
- Understanding the operators leaderboard (owners, admins, managers)
- Interpreting sales breakdowns and comparisons (owners, admins, managers)
- Using the rebooking rate and revenue trend charts (owners, admins, managers)
- Reading your personal performance card, products/services breakdown, monthly targets, and CSV export (staff, receptionists)
- Reading the Commission Tracker (anyone on a commission scheme)
Time to complete: 10-15 minutes
Prerequisites
Before you begin, make sure you have:
- A Luminate account (any role)
- At least a few completed appointments and transactions (for meaningful data)
- Access to the Dashboard (visible in the sidebar)
Step-by-Step Instructions
Step 1: Navigate to the Dashboard
- Log in to Luminate
- Click Dashboard in the sidebar menu (it's usually the first item)
- The dashboard loads showing your salon's performance overview
The dashboard is your command centre - it's designed to give you the most important information without needing to run individual reports.
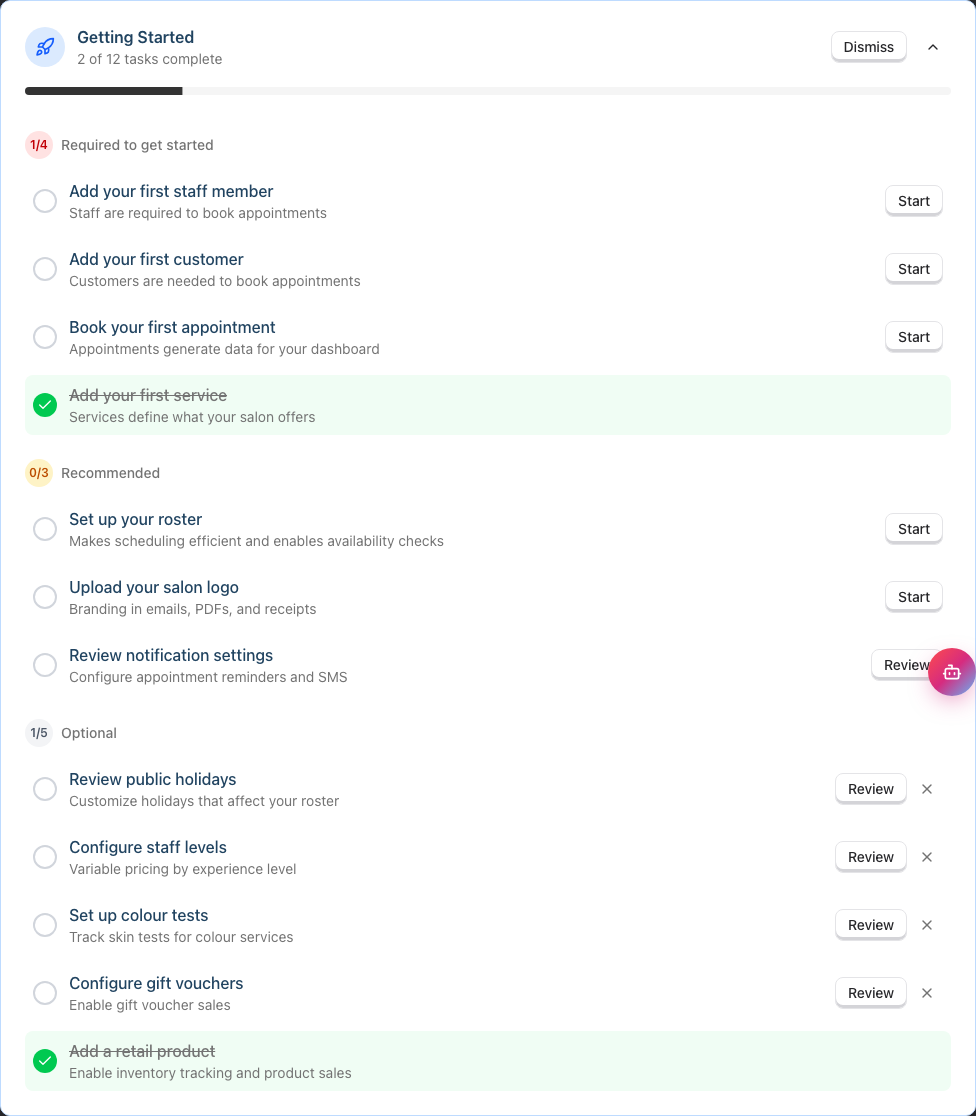
Note: If your salon is still being set up, you'll see a Getting Started checklist at the top of the dashboard. It shows how far you've got (for example "2 of 12 tasks complete") with a progress bar, and sorts the work into three groups:
- Required to get started - the steps you need before you can book anything, such as adding your first staff member, customer, service, and appointment
- Recommended - steps that make the salon run better, such as setting up your roster and uploading your logo
- Optional - extras like gift vouchers and staff levels. Each optional row has an × (Dismiss this item) at its right-hand end if that step doesn't apply to you
Use the chevron button to collapse the card, or Dismiss to hide it altogether. Once every step is done you get a You're all set! panel; click Got it, thanks! and the checklist won't come back. You can reopen it at any time from Setup Guide in the user menu.
The checklist is visible to owners and admins — the people who can act on it. See Tutorial 1.4: The Onboarding Checklist for a walk through every item, and Tutorial 1.1: Welcome to Luminate for more on initial setup.
Step 2: Understanding the "Right Now" Section
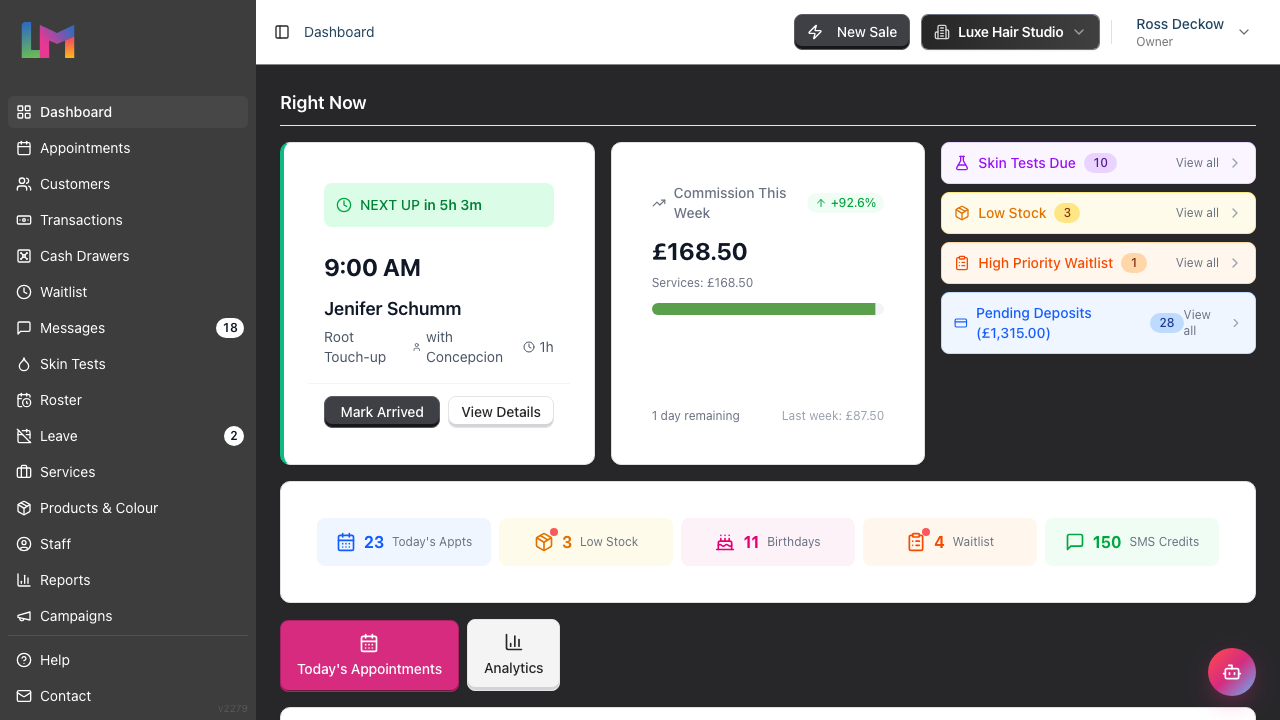
The top section of the dashboard (headed Right Now) shows real-time information about today. It always reflects today, regardless of the time period you choose lower down. It contains a row of cards followed by the quick stats bar.
Next Appointment Card
- Displays your next upcoming appointment for today with a live countdown labelled NEXT UP
- Shows the appointment time, customer name, service, the staff member it's with, the duration, and any badges on the appointment or customer
- The countdown pill changes colour as the appointment approaches — green when there's plenty of time, amber within about 20 minutes, orange within 10 minutes, and red within the last 5 minutes (or once it's due)
- Click Mark Arrived to check the customer in (the button then shows Arrived), or View Details to open the full appointment
- When there are no more appointments today, the card shows "No more appointments today" with a link to the calendar
Commission This Week Card (commission-based staff only)
- Staff on a commission scheme see a Commission This Week card in place of the appointment-only layout
- Shows this week's commission so far, split into services and products, with a progress bar comparing it to last week and a coloured badge for the percentage change
- The footer shows how many days remain in the week and last week's total for reference
- This card only appears for staff whose pay is commission-based; other users don't see it
Alerts Panel (Skin Tests Due is shown to owners, admins, and managers only) The alerts panel shows collapsible categories for items requiring attention:
- Skin Tests Due - Customers with upcoming appointments who need patch tests (full-access users only)
- Low Stock - Products below their minimum stock threshold
- High Priority Waitlist - Urgent waitlist entries
- Pending Deposits - Appointments with unpaid deposit amounts, with the total outstanding shown in the heading
Each category can be expanded to see individual items (up to 3 per category), with links to take action. Click View all on any category to see the full list. Pending deposits also show a Take Payment shortcut for each appointment. The panel only appears when there's at least one item to act on.
Step 3: Reading the Quick Stats Bar
At the bottom of the "Right Now" section, you'll find a compact stats bar with five metrics:
| Stat | What It Shows |
|---|---|
| Today's Appts | Number of appointments scheduled for today |
| Low Stock | Products below their minimum stock level (amber warning if any) |
| Birthdays | Customers with birthdays in the next 7 days |
| Waitlist | Active waitlist entries (orange warning if high priority items) |
| SMS Credits | Your remaining SMS credit balance (red warning if below 50) |
Tip: Click on any stat to navigate directly to that section. For example, clicking Low Stock takes you to the Products page filtered to show low stock items. On mobile devices, tap a stat to expand it, then tap "View" to navigate. SMS Credits is the exception: it only links through to the SMS settings for owners and admins, because they are the only roles who can change salon settings. Everyone else still sees the balance, it simply isn't clickable.
Step 4: Switching Between the Tabs
Below the "Right Now" section, the rest of the dashboard is split into two tabs:
- Today's Appointments (open by default) — the full schedule for today
- Analytics — your period-based performance data
Click either tab heading to switch between them.
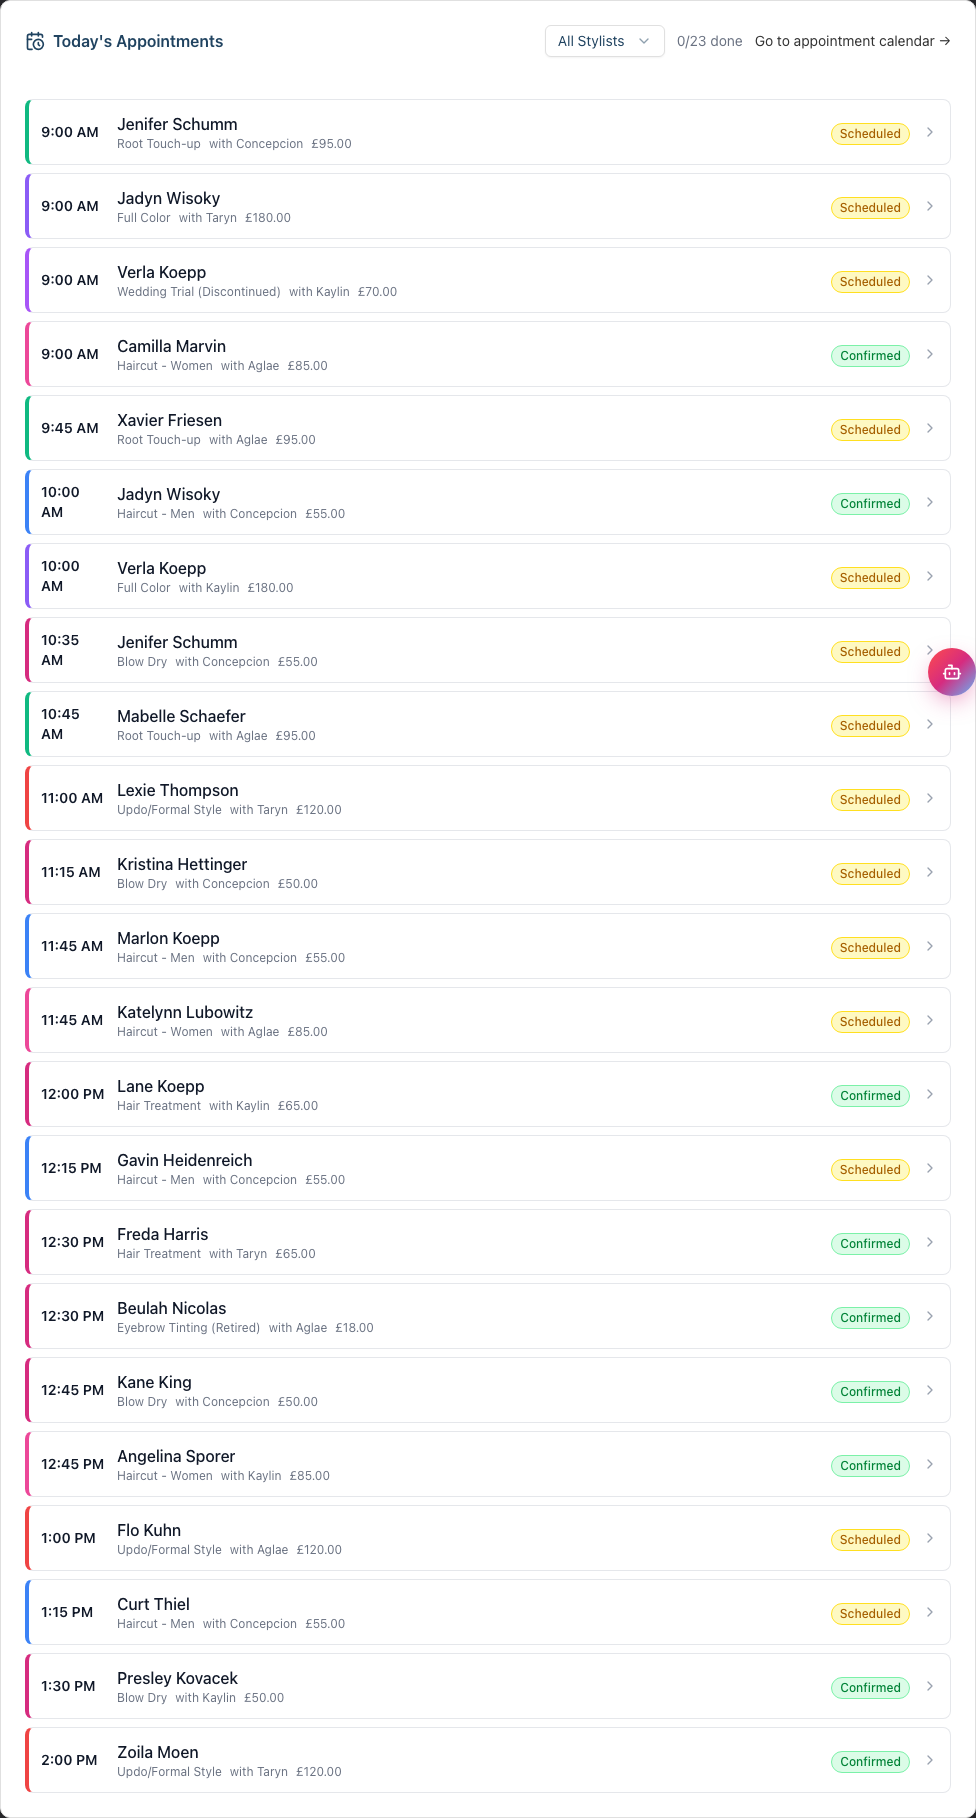
The Today's Appointments tab lists today's appointments as cards, each showing the time, customer, service, status, and (for owners, admins, managers, and receptionists) the staff member. A counter in the header shows how many are done (e.g. "3/8 done"), and completed appointments are tucked into a collapsible Completed section so the active ones stay at the top. When you can view everyone's appointments and more than one stylist is working today, an All Stylists filter lets you narrow the list to a single team member, and a Go to appointment calendar → link jumps to the full calendar. Use Mark Arrived on a row to check a customer in without leaving the dashboard.
When every appointment for the day is finished, the list is replaced by a green All appointments completed for today! message. If nothing is booked at all, you get No appointments scheduled for today with a Book an appointment → link.
Step 5: The Analytics Tab
The Analytics tab contains period-based performance data. What you see here depends on your role:
- Owners, admins, and managers see the full salon-wide analytics — the period selector, Sales breakdown, Operators leaderboard, Re-Booking rate, and Revenue Trend.
- Staff and receptionists see the period selector and their own "My Performance" card, with their personal products/services breakdown, monthly targets, and a CSV export.
On mobile, the charts in this tab are collapsed behind an Analytics show/hide button to keep the page short; on desktop they're always visible.
Step 6: Using the Time Period Selector
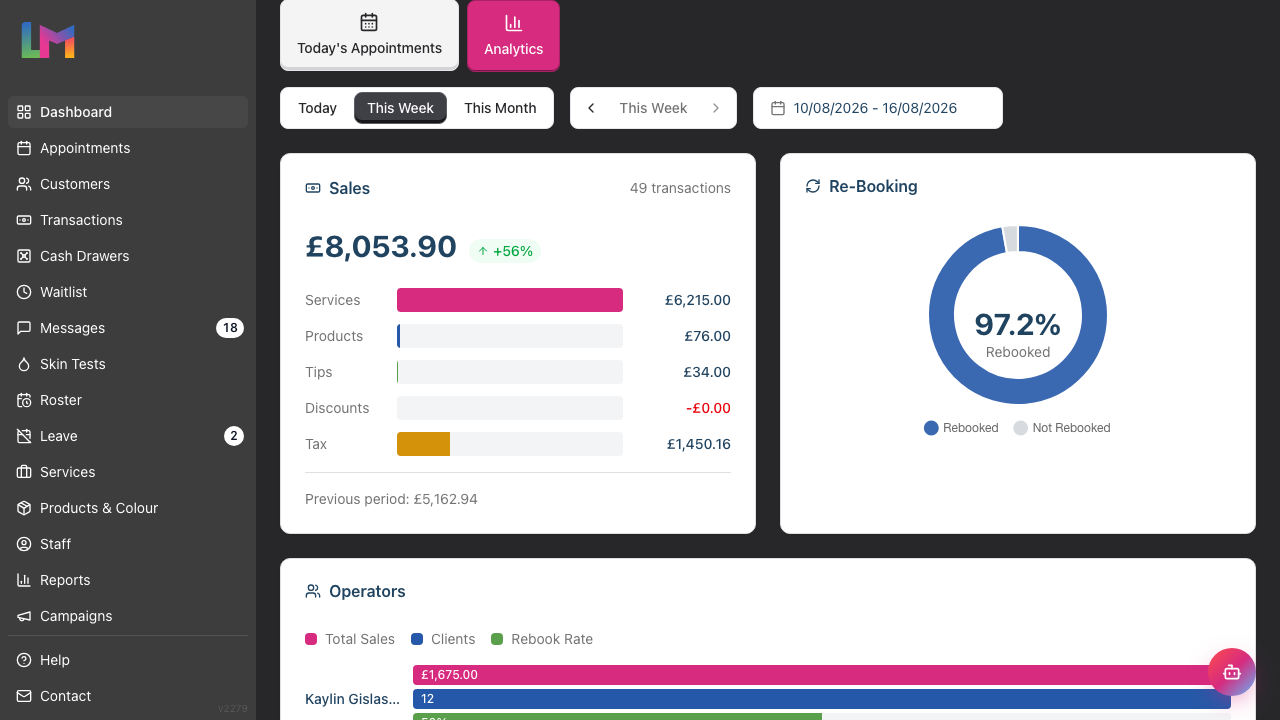
The time period selector sits at the top of the Analytics tab and appears for all users — it controls the date range for the salon-wide analytics (owners, admins, managers) or the "My Performance" card and its breakdowns (staff, receptionists).
Preset Options:
- Today - Current day only
- This Week - Current week (Monday to Sunday)
- This Month - Current calendar month
Navigating Between Periods: Next to the preset buttons, you'll see left and right arrow buttons for stepping through periods:
- Click the left arrow to move to the previous period (e.g. last week)
- Click the right arrow to move to the next period (e.g. next week)
- The label between the arrows updates to show the actual date range (e.g. "17 Mar – 23 Mar" instead of "This Week")
- When you've navigated away from the current period, click the date label in the centre to jump back to the current period
- The right arrow is disabled when you're already viewing the current period
Custom Date Range:
- Click the date range picker (shows as a date input field)
- Select your start and end dates
- The dashboard updates automatically when you select dates
Note: When using a custom date range, the navigation arrows are hidden — use the date picker to change your range instead.
All the charts and statistics update to reflect your selected time period. The "Right Now" section at the top always shows today's data regardless of the period selector.
Step 7: Understanding the Operators Leaderboard
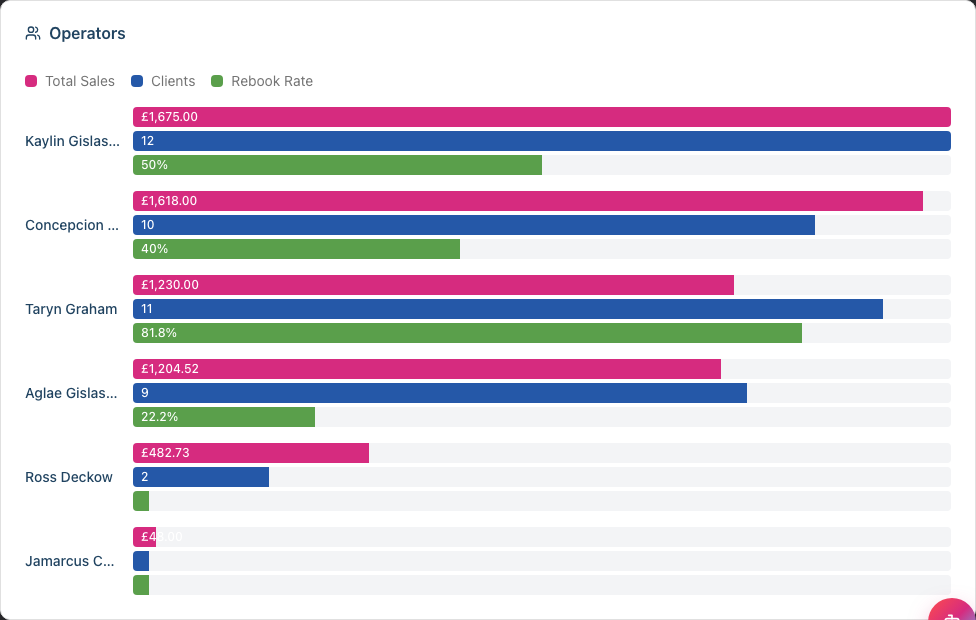
The Operators section shows your staff performance with visual bar charts for each metric:
| Metric | What It Means |
|---|---|
| Total Sales (magenta bars) | Total revenue generated (services + products) |
| Clients (blue bars) | Number of unique customers served |
| Rebook Rate (green bars) | Percentage of customers who booked their next appointment |
How the display works: Each staff member has three horizontal bars showing their performance in each metric. The Total Sales and Clients bars are scaled against the best performer in each category, so the top person's bar is always full width and everyone else reads as a share of it. The Rebook Rate bar is a straight percentage instead - a full bar means 100%, whoever else is on the list.
Using this data:
- Identify your top performers across different metrics
- Spot team members who might need additional support
- Track rebooking rates to improve customer retention
- Up to 10 active staff members are shown
Step 8: Understanding the Sales Breakdown
The Sales section provides a detailed breakdown of your revenue with horizontal bar charts:
| Category | Description | Bar Colour |
|---|---|---|
| Services | Revenue from all services performed | Magenta |
| Products | Revenue from retail product sales | Blue |
| Tips | Tips received by staff | Green |
| Discounts | Total discounts applied (shown as a negative) | Red |
| Tax | Tax collected on taxable items | Golden Yellow |
The Total Sales figure is displayed prominently at the top of the card, along with the number of transactions for the period.
Period Comparison: The total sales shows a comparison to the previous period:
- A green badge with an up arrow (↑) indicates growth compared to the previous period
- A red badge with a down arrow (↓) indicates a decrease
- The percentage change is shown in the badge
For example, if you're viewing "This Week", the comparison is to last week. If you're viewing "This Month", it compares to last month. A Previous period total appears at the bottom of the card whenever that earlier period had any sales.
Step 9: Reading the Re-Booking Rate
The Re-Booking section shows what percentage of customers booked their next appointment:
- A pie chart displays the proportion of rebooked vs not rebooked customers
- The percentage is displayed in the centre of the chart
- A legend shows the breakdown of "Rebooked" (blue) and "Not Rebooked" (grey)
How it's calculated: The rebooking rate looks at customers who had completed appointments in the selected period and checks how many have a future appointment booked (after the period end date).
Industry benchmark: Aim for a rebooking rate above 50%. Top-performing salons often achieve 70% or higher.
Step 10: Using the Revenue Trend Chart
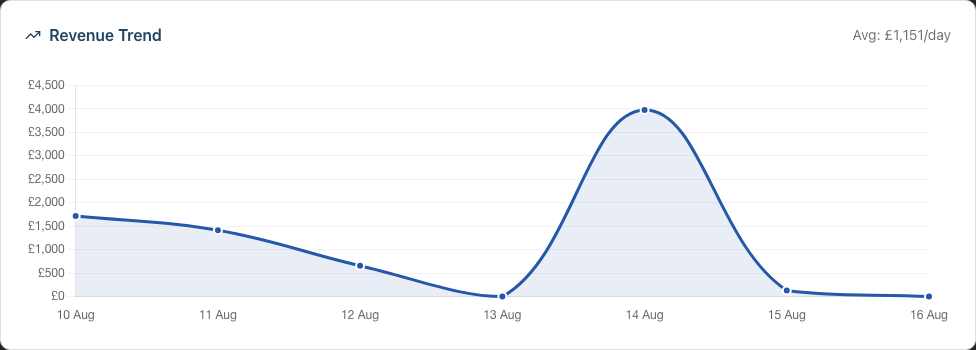
The Revenue Trend chart visualises your income over the selected period as a line chart:
- X-axis: Days in your selected period
- Y-axis: Revenue amount in your salon's currency
- Hover over any point to see the exact revenue figure for that day
- The average revenue per day is shown in the card header
What to look for:
- Consistent upward trends indicate growth
- Dips might correspond to quieter days or staff holidays
- Spikes often align with promotions or busy periods
The chart shows a filled area under the line, making it easy to visualise overall revenue patterns.
Step 11: Your Personal Performance — Breakdown, Targets, and Export (staff and receptionists)
Below your My Performance card in the Analytics tab, you'll find a detailed view of your own numbers — and only yours. You never see another team member's figures here, and they never see yours.
Monthly Targets: If your manager has set you monthly goals, a Monthly Targets card shows a progress bar for each one — Product Sales (value), Products Sold (units), Total Revenue, and/or Services Completed. Each bar shows where you are against the goal (for example "£2,344.30 / £5,000.00") with the share underneath ("46.9% of target"). These are always measured against the current calendar month, which the card names in its heading (for example Monthly Targets (August 2026)), regardless of the period you've selected above — so they're a consistent goalpost. Each bar turns green once you hit 100%. If no targets are set, this card simply doesn't appear — ask your manager if you'd like some to aim for.
Products Sold and Services Completed: Two itemised lists show exactly what you sold and did in the selected period — each service (with how many you completed and the revenue) and each product (with units sold and revenue), ordered with your highest-earning items first and finishing with a Total row. Use the period selector at the top to change the range; the lists update to match.
Export CSV: Click Export CSV (next to the period selector) to download your itemised products and services for the selected period as a spreadsheet that opens in Excel, Numbers, or Google Sheets.
Note: This section is for staff and receptionists viewing their own performance. Owners, admins, and managers see the salon-wide Operators leaderboard and Sales breakdown instead.
Step 12: The Commission Tracker (commission-based staff)
If your pay is commission-based, a Commission Tracker card sits at the bottom of the Analytics tab, below everything else. Its heading shows your commission total for the selected period, and inside you'll find a Daily Trend chart and a Breakdown of where that commission came from. Like the rest of the tab, it follows the period selector, so switching to This Month or stepping back a week re-reads the tracker too.
The card follows your pay scheme, not your role, so admins and managers paid on commission see it too - not just stylists. See Tutorial 4.4: Tracking Staff Performance and Commission for how the figures are worked out and how tiers affect them.
Common Pitfalls
"The dashboard shows zero or very little data"
This is normal for new salons. The dashboard displays real data from your operations. Once you start completing appointments and processing transactions, the metrics will populate. Give it a few days of normal trading.
"My sales figures don't match what I expected"
The dashboard shows completed transactions only. Pending or cancelled transactions aren't included. Also, check your time period selector - you might be viewing a different date range than intended.
"I can't see the Analytics section with charts"
The full Analytics section (Sales, Operators, Re-Booking, Revenue Trend) is only visible to Owners, Admins, and Managers. If you're logged in as Staff or Receptionist, you'll see:
- The time period selector — you can switch between Today, This Week, This Month, navigate between periods, or choose a custom date range
- Staff members see a "My Performance" card showing their personal revenue, appointments, clients, commission, tips, and rebooking rate, with a rank badge showing their position among the team
- Receptionists see a simplified "My Performance" card with revenue, commission, and tips (since they don't take appointments)
"The comparison percentages seem wrong"
Comparisons are made to the equivalent previous period. "This Week" compares to "Last Week", not to the same week last month. For monthly comparisons, select "This Month".
"I can't see a Commission This Week panel"
The Commission This Week card only appears for staff whose pay is commission-based. If you're not on a commission scheme — or you're an owner, admin, manager, or receptionist — you won't see it, and the "Right Now" row simply shows the next appointment alongside the alerts panel instead.
Tips and Best Practices
- Check the "Right Now" section first thing each morning - It gives you an instant overview of what's scheduled, alerts requiring attention, and pending deposits
- Use the quick stats bar for action items - Low stock items need ordering, upcoming birthdays are outreach opportunities, and low SMS credits need topping up
- Expand the Alerts panel to see details - Each alert category can be expanded to show specific items that need attention, with links to take action
- Monitor rebooking rates weekly - This is a leading indicator of customer loyalty and future revenue
- Compare periods regularly - Week-on-week comparisons help you spot trends early
- Use the Operators chart to identify coaching opportunities - Low rebooking rates might indicate a need for client retention training
- On mobile, remember to open the Analytics tab - The dashboard opens on Today's Appointments; switch tabs to see your performance charts, and tap the Analytics show/hide button if the charts are collapsed
Related Tutorials
- Tutorial 9.2: Running Revenue Reports - Get detailed daily revenue breakdowns
- Tutorial 9.3: Staff Performance and Commission Reports - Deep dive into individual staff metrics
- Tutorial 9.4: Customer Analytics - Identify your top customers
- Tutorial 4.4: Tracking Staff Performance and Commission - How commission figures and the Commission Tracker work
- Tutorial 1.1: Welcome to Luminate - Basic navigation and orientation
- Tutorial 1.4: The Onboarding Checklist - Working through the Getting Started steps
- Tutorial 11.1: Skin Test Management - Managing patch test compliance
Frequently Asked Questions
Can I customise what appears on the dashboard?
The dashboard layout is fixed to show the most important metrics for salon management. However, you can control the time period for the Analytics section to focus on the data that matters most to you. The "Right Now" section always shows today's data.
How often does the dashboard data refresh?
The dashboard shows real-time data. When you load or refresh the page, it pulls the latest information. There's no need to manually refresh - just reload the page.
Can staff see other staff members' performance?
Staff members can only see their own performance metrics in the "My Performance" card. The full Operators leaderboard and salon-wide analytics are only visible to Owners, Admins, and Managers. Staff can use the period selector to view their personal stats for different time periods.
Why do my quick stats show different numbers than my reports?
Quick stats are designed for "at a glance" information and may use slightly different logic. For example, "Today's Appts" counts all non-cancelled appointments, while revenue reports only count completed transactions. For detailed figures, always refer to the specific reports.
Can I export dashboard data?
Staff and receptionists can export their own figures: in the Analytics tab, the Export CSV button next to the period selector downloads your itemised products and services for the selected period. The salon-wide analytics (Sales, Operators, etc.) don't export directly from the dashboard — for those, use the dedicated reports (Revenue, Staff Performance, and so on), which all have CSV export options.
What does the SMS Credits figure mean?
This shows your remaining balance for sending SMS notifications (appointment reminders, confirmations, etc.). When credits drop below 50, the stat turns red as a warning. See Tutorial 10.5: SMS Balance and Usage Tracking for details on managing your SMS credits.
There's a Getting Started checklist on my dashboard — how do I remove it?
The onboarding checklist appears for owners and admins when your salon still has setup steps to complete. Work through each item (adding staff, configuring services, setting hours, etc.) and the checklist finishes with a You're all set! panel; click Got it, thanks! and it's gone. If you'd rather clear it now and finish setup later, click Dismiss in the card header and confirm. You can bring it back at any time from Setup Guide in the user menu. To hide a single optional row without dismissing the whole card, click the × at the end of that row.
Why are some alerts not showing on my dashboard?
The Alerts panel only appears when there are items requiring attention. If all skin tests are up to date, stock levels are healthy, no high-priority waitlist items exist, and no deposits are pending, the alerts panel won't be displayed. Note that the Skin Tests Due category is only visible to owners, admins, and managers.
What's the difference between the "Right Now" section and "Analytics"?
The "Right Now" section always shows today's data regardless of period selection - it's your real-time operational view. The "Analytics" section shows historical performance data for the selected time period (Today, This Week, This Month, or a custom range).
I'm a receptionist - why does my dashboard look different?
Receptionists see today's appointments and the alerts panel (so they can manage the front desk), but not the salon-wide analytics. In the Analytics tab you'll see a "My Performance" card showing your own revenue, commission, and tips.
Last Updated: August 2026