
Running Revenue Reports
Introduction
The revenue report shows your daily income broken down by source. It also shows stored value sold, such as gift vouchers and account-credit top-ups, as takings that are not yet revenue. This tutorial explains how to view revenue by date, understand the breakdown, filter by date range, read the trend chart, and export data for accounting.
Who this is for: Salon owners, admins, and managers responsible for financial tracking and accounting.
What you'll learn:
- Navigating to the Daily Revenue report
- Understanding the summary cards
- Filtering by date range
- Reading the revenue table
- Understanding the revenue trend chart
- Exporting data for accounting
Time to complete: 10-15 minutes
Prerequisites
Before you begin, make sure you have:
- A Luminate account with Owner, Admin, or Manager role
- At least some completed transactions in your salon
- For exporting: Owner or Admin role (Managers can view but not export)
Step-by-Step Instructions
Step 1: Navigate to the Reports Section
- Log in to Luminate
- Click Reports in the sidebar menu
- You'll see the Reports index page with categories: Financial Reports, Customer Reports, Staff Reports, Messaging Reports, and Inventory Reports (an Appointment Reports category is listed separately under "Coming Soon")
The tiles you see depend on your permissions — each report is only shown if your role can access it.
Step 2: Open the Daily Revenue Report
- In the Financial Reports category, find Daily Revenue
- Click on it to open the report
- The report loads showing the last 30 days by default — adjust the date range at any time using the filter (see Step 4)
Step 3: Understanding the Summary Cards
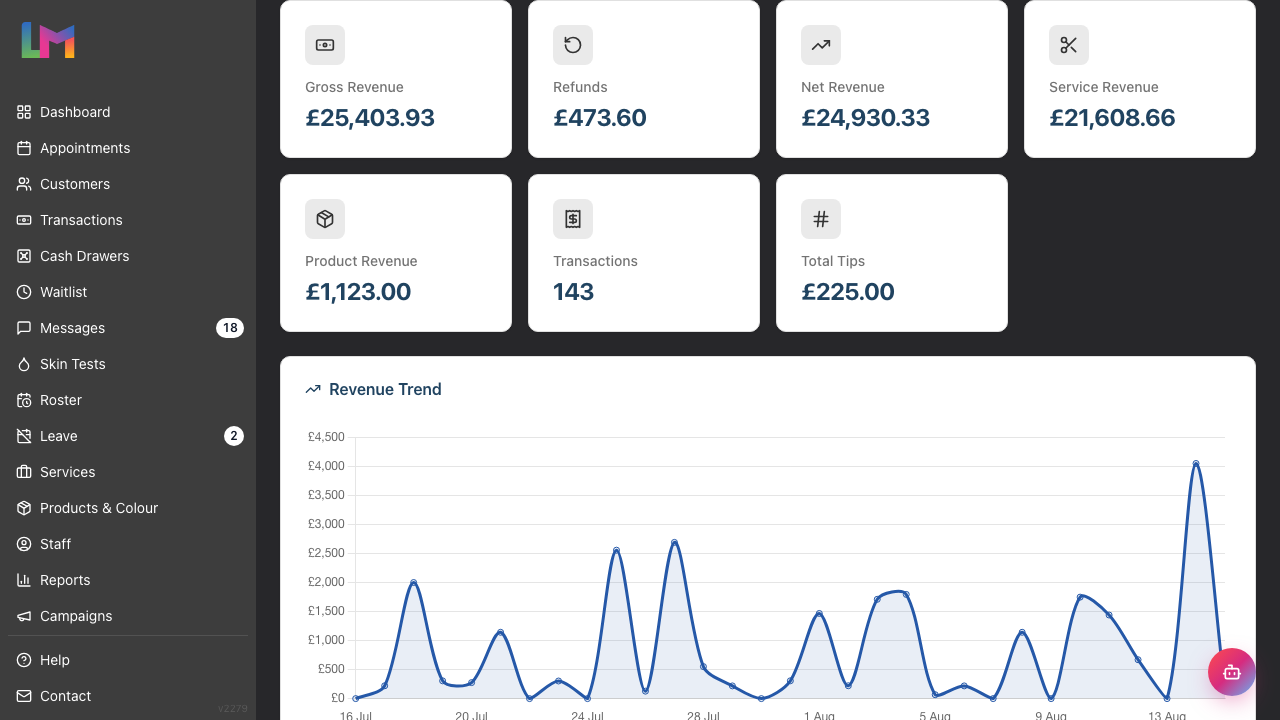
At the top of the report, you'll see eight summary cards:
| Card | What It Shows |
|---|---|
| Gross Revenue | Sum of earned revenue before refunds are taken off. Selling stored value is excluded until it is redeemed |
| Refunds | Earned-revenue value of refunded transactions |
| Net Revenue | Gross revenue minus refunds — your actual earnings |
| Service Revenue | Revenue from services only |
| Product Revenue | Revenue from product sales only |
| Stored value sold (not revenue) | Gift vouchers and account credit sold. This is visible as money taken, but is not income until the customer spends it |
| Transactions | Total number of transactions |
| Total Tips | Sum of all tips received |
These cards give you a quick overview of your salon's financial performance for the selected date range. Gross Revenue, Net Revenue, and the service/product breakdown help you understand where your income comes from and how refunds affect your bottom line. The Stored value sold card explains why till takings can be higher than revenue without hiding the difference.
Step 4: Using the Date Range Filter
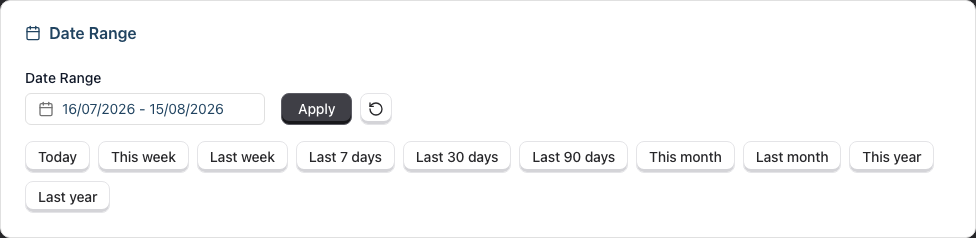
The date filter appears in a card below the header with "Date Range" as the title.
Using the Date Picker:
- Click the date range picker field
- Select your start date
- Select your end date
- Click the Apply button to update the report
- Click the reset button (circular arrow icon) to clear filters
Quick Preset Buttons: Below the date picker, you'll find preset buttons for common date ranges:
- Today — Current day only
- This week — Monday to Sunday of current week
- Last week — Previous full week (Monday to Sunday)
- Last 7 days — Rolling 7-day period
- Last 30 days — Rolling 30-day period
- Last 90 days — Rolling 90-day period
- This month — Current calendar month
- Last month — Previous calendar month
- This year — Year to date
- Last year — Previous calendar year
Clicking any preset button automatically applies that date range and updates the report.
Tip: Use "Last month" at the start of each month to review the previous month's complete figures for accounting.
Step 5: Reading the Revenue Table
The main table is titled "Daily Breakdown" and shows revenue data for each day in your selected range. Subtotal shows the whole sale, while the separate stored-value figure explains the amount excluded from Revenue.
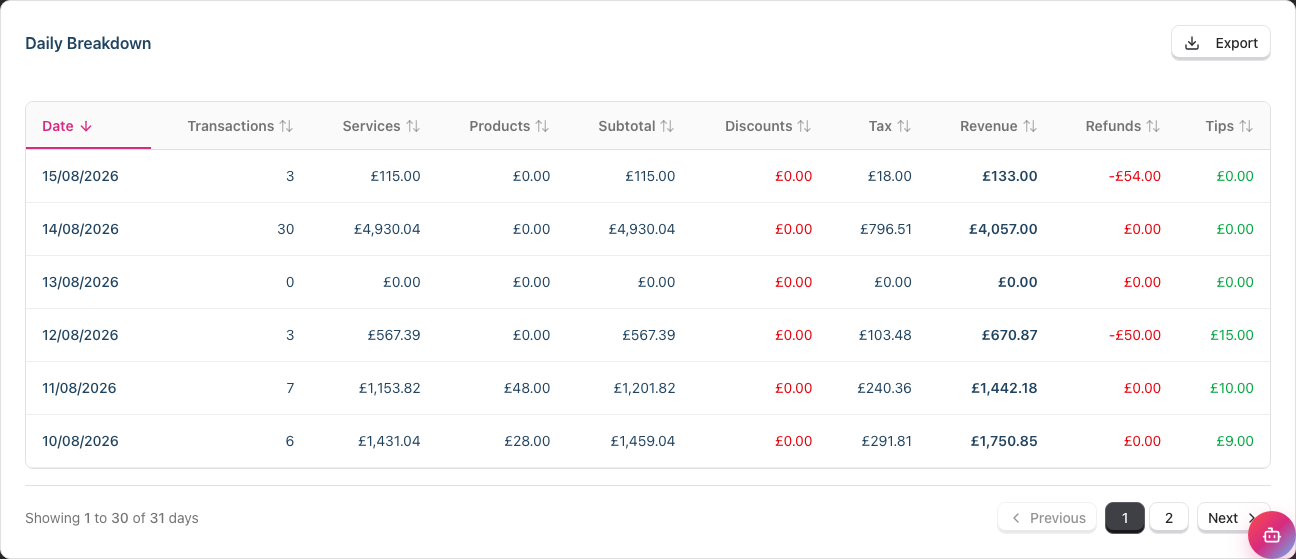
| Column | Description |
|---|---|
| Date | The transaction date (formatted according to your salon's date settings) |
| Transactions | Number of completed transactions that day |
| Services | Total of actual service lines. Deposits and colour-overage charges are no longer grouped into Service Revenue; they remain visible in Subtotal and Revenue |
| Products | Revenue from product sales |
| Subtotal | Full transaction subtotal, including stored value sold and other line types, before tax |
| Stored value sold (not revenue) | Gift vouchers and account-credit top-ups sold that day. This is part of Subtotal and takings, but excluded from Revenue |
| Discounts | Total discounts applied (shown in red, with a minus sign on any day that had a discount) |
| Tax | Tax collected on taxable items |
| Revenue | Earned revenue for the day after excluding stored value sold and any deposit credit already counted on an earlier day (displayed in bold) |
| Refunds | Value of any refunded transactions (shown in red, with a minus sign on any day that had a refund) |
| Tips | Tips received (displayed in green) |
Sorting: Click any column header to sort the table by that column. Click again to reverse the sort order. The currently sorted column shows an indicator.
Pagination: If you have many days of data, use the pagination controls at the bottom to navigate through pages. The report shows 30 days per page.
Step 6: Understanding the Revenue Trend Chart
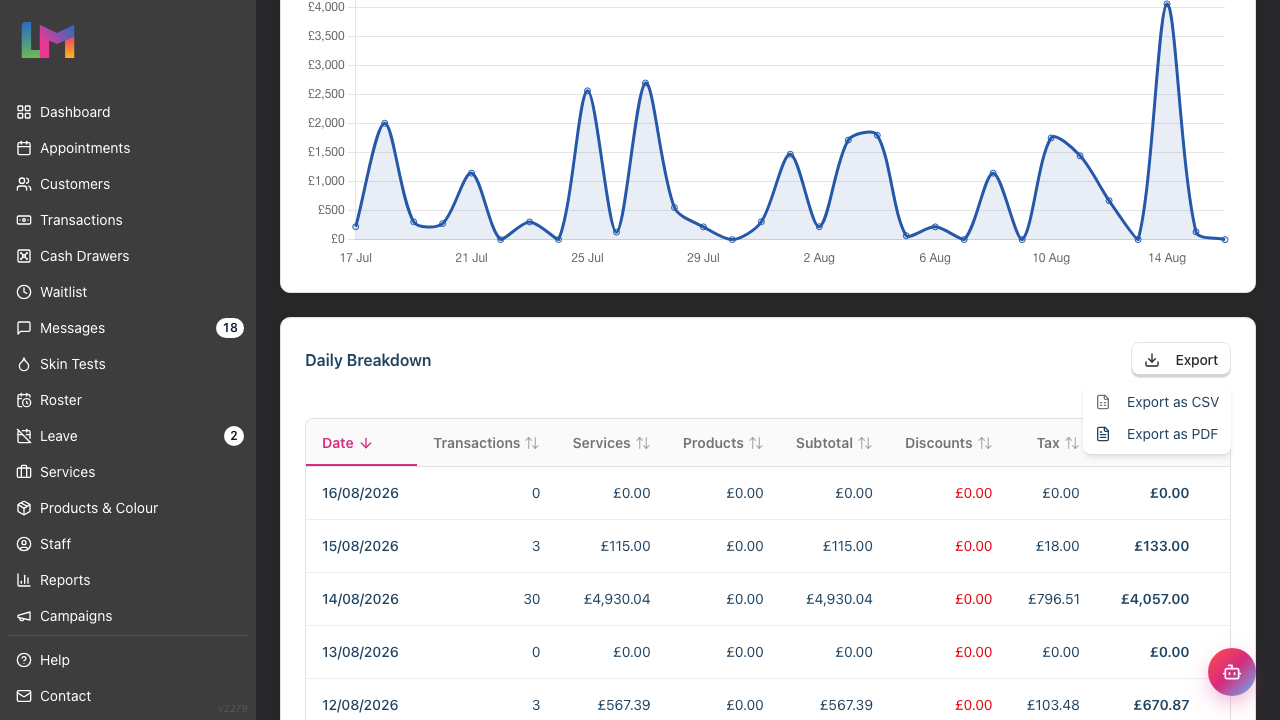
Above the table, you'll see a line chart titled "Revenue Trend":
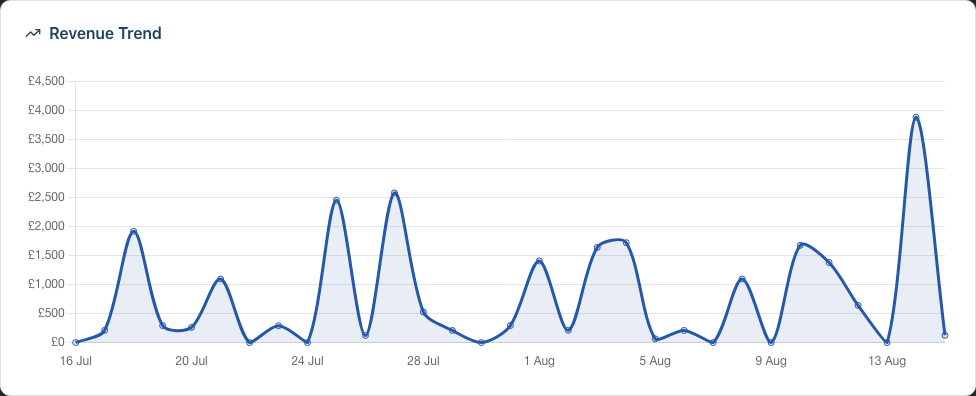
- Line chart showing daily revenue over the selected period
- Hover over any point to see the exact figures
- The chart automatically scales to fit your data
- Data is displayed from oldest to newest (left to right)
What to look for:
- Upward trends indicate growing revenue
- Peaks on certain days might indicate busy periods (e.g., Saturdays)
- Dips might represent slower days or days when the salon was closed
Step 7: Exporting Revenue Data
To export your revenue data for accounting or further analysis:
Set your desired date range using the filter
In the "Daily Breakdown" section, click the Export button (top right of the table card)
A dropdown menu appears with options:
- Export as CSV — For spreadsheet applications (Excel, Numbers, Google Sheets)
- Export as PDF — For printing or archiving
Click your preferred format
The file downloads to your computer
Export includes:
- All data from the current filtered view
- Daily breakdowns with all columns (Date, Transactions, Service Revenue, Product Revenue, Subtotal, Stored value sold, Discounts, Tax, Revenue, Refunds, Tips)
- In the PDF, the headline figures Gross Revenue, Refunds and Net Revenue, so the file reconciles with the cards on screen
- Suitable for importing into accounting software
Note: Only Owners and Admins can export data. Managers can view reports but the Export button won't appear for them.
Common Pitfalls
"My revenue figures don't match my till readings"
The Daily Revenue report counts every completed and refunded transaction. Draft, pending, and cancelled transactions are excluded.
The report counts a sale on the day it was completed, whether or not the customer has paid yet. A sale left on account still appears here, so this report will read higher than your till takings. Check the Accounts Receivable report for the balances still owed (see Tutorial 9.5).
Gift vouchers and account-credit top-ups work in the other direction: the money is in your till takings and Subtotal on the day of sale, but appears separately under Stored value sold (not revenue) instead of Revenue. When the customer later spends that value, the service or product is recognised as revenue in full. This prevents the same money being counted twice.
"Tips aren't showing in the report"
Tips must be recorded during the transaction. If tips are given in cash after the sale and not entered into Luminate, they won't appear. See Tutorial 2.4 for adding tips at the point of sale.
"The export button is missing"
Only Owners and Admins can export reports. If you're logged in as a Manager, you can view reports but won't see the export option. Contact your salon owner if you need exported data.
"I see red numbers in the Discounts or Refunds columns"
This is correct — discounts and refunds reduce revenue, so they appear in red to indicate they subtract from your totals. The Revenue column already accounts for discounts, showing your net revenue. Refunds are shown separately so you can track how much was returned to customers.
"Some days show zero revenue"
Days when the salon was closed (public holidays, Sundays, etc.) will show zero or won't appear at all. This is expected — there were no transactions to report.
Tips and Best Practices
- Run this report monthly for accounting — Export the previous month's data at the start of each new month while figures are fresh
- Use "Last 30 days" for quick trends — This gives a rolling view of recent performance
- Compare month-on-month — Export multiple months and compare in a spreadsheet for longer-term trend analysis
- Use consistent time periods — When comparing performance, always use the same time periods (e.g., full weeks, full months)
- Review the service vs. product split — Use the Service Revenue and Product Revenue cards and columns to understand your revenue mix and spot retail growth opportunities. Service Revenue now means only actual service lines; deposits and colour-overage charges remain in Subtotal and Revenue but are not labelled as services
- Investigate anomalies — If you see an unusually high or low day, investigate — it might be a mistake or a learning opportunity
Related Tutorials
- Tutorial 9.1: Understanding Your Dashboard — Quick overview of salon performance
- Tutorial 9.3: Staff Performance and Commission Reports — See revenue broken down by staff member
- Tutorial 9.5: Accounts Receivable and Outstanding Balance Reports — Track unpaid balances
- Tutorial 8.1: Understanding Transactions and Payment Status — How transactions flow through the system
- Tutorial 8.4: Deposits and Pre-Payments — How a deposit is counted when you take it and when it is redeemed
Frequently Asked Questions
What's the difference between this and the Dashboard sales figures?
The Dashboard provides a quick summary, while the Daily Revenue report gives you a complete breakdown by day with export capability. Use the Dashboard for a glance; use this report for detailed analysis.
What's the difference between Gross Revenue and Net Revenue?
Gross Revenue is your total revenue from completed transactions. Net Revenue subtracts any refunds, showing what you actually kept. If you had no refunds in the selected period, both figures will match.
What's the difference between Subtotal and Revenue?
Subtotal is the full transaction value before tax, including stored value sold and other line types. Revenue is earned income after stored value sold and redeemed deposit credit are taken out, with tax included. The Stored value sold (not revenue) column makes the main difference visible.
Why is Revenue lower than Subtotal − Discounts + Tax on some days?
Because a deposit was redeemed or stored value was sold that day. Luminate counts a booking deposit as revenue on the day you took it. When the customer comes in and the deposit pays part of the bill, that portion is left out of Revenue. Gift vouchers and account-credit top-ups are also left out when sold, then the service or product is counted when the customer spends them. Subtotal still shows the full transaction, and Stored value sold (not revenue) identifies the stored-value part. See Tutorial 8.4 for how deposits work.
Can I see revenue by service type or product category?
The Daily Revenue report breaks down each day into Services and Products columns. For more granular breakdowns by individual services or staff members, use the Staff Performance report which shows service-level detail.
How far back can I view revenue data?
Luminate stores your complete transaction history. You can select any date range from when you started using the system. There's no limit on historical data access.
Why might my tax figures vary day to day?
Tax is only collected on taxable items. If some of your services or products are VAT-exempt or zero-rated, the tax amount will depend on what was sold that day. Products are typically taxable while some services may not be.
Can I schedule this report to run automatically?
Currently, reports must be run manually. However, making it part of your weekly or monthly routine ensures you stay on top of your figures.
Last Updated: August 2026