
Staff Performance and Commission Reports
Introduction
See which team members are your top performers. Learn how to run staff performance reports, view revenue and commission by staff member, understand how commission is calculated on services and products, track transaction counts, and export data for payroll processing.
Who this is for: Salon owners, admins, and managers who need to track team productivity and calculate commissions.
What you'll learn:
- Running the staff performance report
- Understanding revenue by staff member
- How commission is calculated
- Reading the performance chart
- Exporting data for payroll
Time to complete: 15-20 minutes
Prerequisites
Before you begin, make sure you have:
- A Luminate account with Owner, Admin, or Manager role
- Staff members set up with commission rates (see Tutorial 4.1)
- Completed transactions attributed to staff members
- For exporting: Owner or Admin role
Step-by-Step Instructions
Step 1: Navigate to the Staff Performance Report
- Log in to Luminate
- Click Reports in the sidebar menu
- In the Staff Reports category, click Staff Performance
- The report loads showing performance for the current period
Step 2: Understanding the Summary Cards
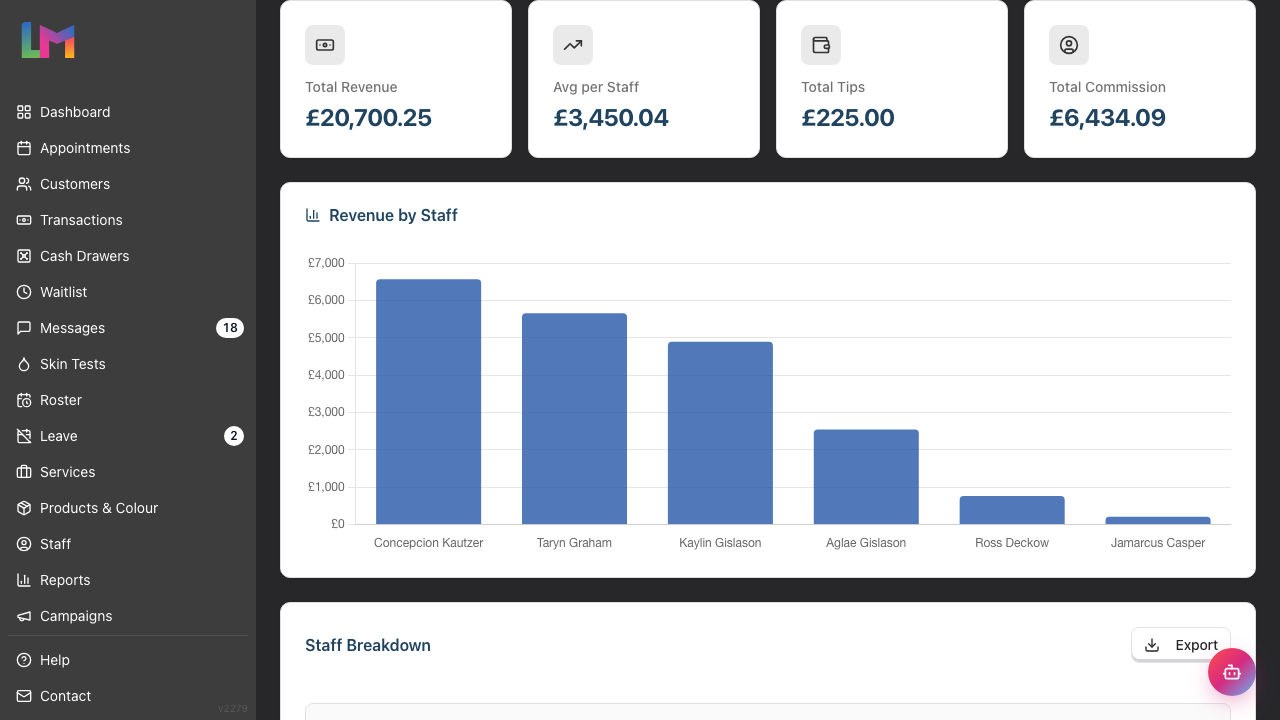
At the top of the report, you'll see four summary cards:
| Card | What It Shows |
|---|---|
| Total Revenue | Combined revenue from all staff |
| Avg per Staff | Average revenue per staff member (only counting those with revenue) |
| Total Tips | Combined tips attributed to all staff |
| Total Commission | Combined commission earned by all staff |
These give you a quick overview before diving into individual staff figures.
Step 3: Using the Date Range Filter
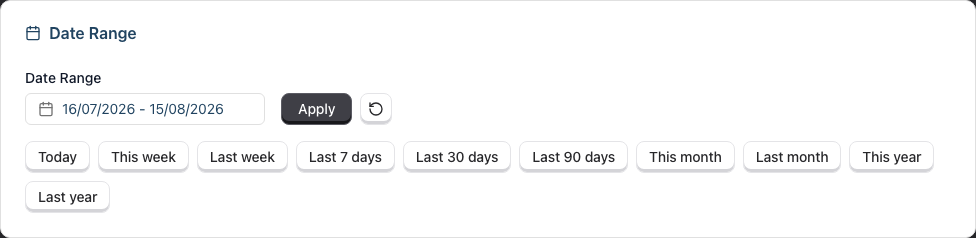
The date filter controls which period you're viewing:
Quick Preset Buttons:
- Today – Current day only
- This week – Current week (Monday to Sunday)
- Last week – Previous full week
- Last 7 days – Rolling 7-day period
- Last 30 days – Rolling 30-day period
- Last 90 days – Rolling 90-day period
- This month – Current calendar month
- Last month – Previous calendar month
- This year – Year to date
- Last year – Previous calendar year
Custom Date Range:
- Click the date range picker
- Select your start and end dates
- Click Apply to update the report
Tip: For payroll processing, use "Last month" to see the complete previous month.
Step 4: Reading the Performance Table
The main table shows each staff member's performance:
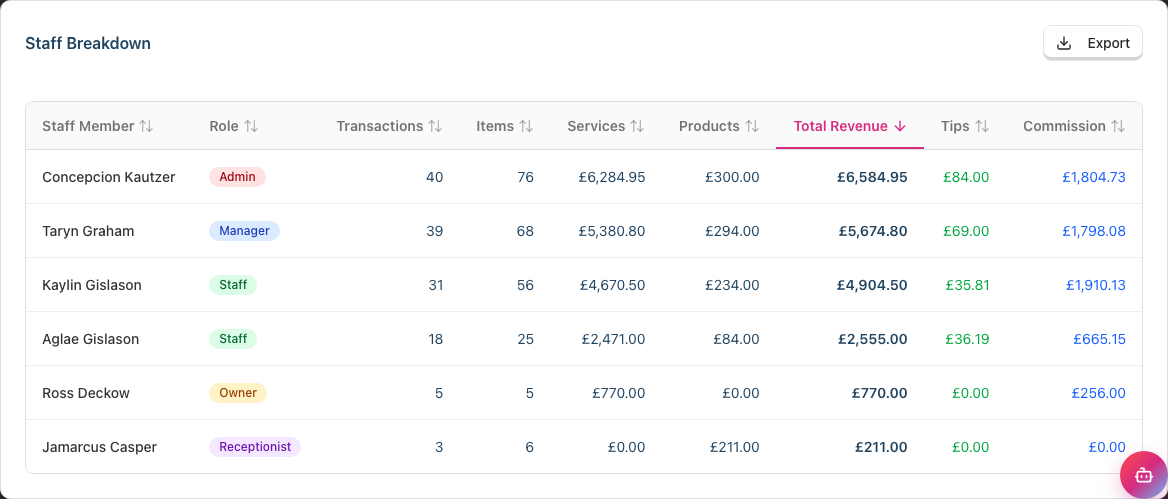
| Column | Description |
|---|---|
| Staff Member | The team member's name (clickable link) |
| Role | Their role (Owner, Admin, Manager, Staff, Receptionist) |
| Transactions | Number of transactions they contributed to |
| Items | Total items (services + products) they sold |
| Services | Revenue from services performed |
| Products | Revenue from product sales |
| Total Revenue | Combined services + products |
| Tips | Tips attributed to this staff member |
| Commission | Commission earned. Only staff on Commission Only or Salary + Commission earn service commission — hourly and salaried staff show £0.00 here, matching what payroll pays them. Product commission is separate and depends on each staff member's own product commission setting |
Sorting: Click any column header to sort, then click it again to reverse the order. All nine columns sort, including Role, Tips and Commission. Sorting is useful for quickly finding:
- Top earners (sort by Total Revenue)
- Busiest service providers (sort by Services)
- Most active staff (sort by Transactions or Items)
- Your biggest commission bill (sort by Commission)
The report opens sorted by Total Revenue, highest first.
Long staff lists: the table shows 20 staff members per page. Page buttons appear below the table when you have more than 20.
Step 5: Understanding Commission Calculations
Commission is worked out from the rate recorded on each transaction line at the time of sale:
How Commission Works:
- When a service or product is added to a transaction, the commission rate that applies is recorded on that line
- Commission = Line Subtotal × Commission Rate
- Example: £500 service × 40% rate = £200 commission
Which service rate applies. For a staff member paid on commission only, Luminate picks the rate in this order:
- The staff member's commission override, if one is set
- The service's own commission rate, if that service has one
- The staff member's default commission rate
Your compensation type decides whether service commission is earned at all:
| Compensation type | Service commission |
|---|---|
| Commission only | The rate frozen on each service line, as above |
| Salary + commission | Recalculated from completed service revenue against the staff member's tier bands (see Tutorial 4.3). No tiers set means no commission |
| Salary or Hourly | None — these staff earn no service commission |
Product Commission:
- Product commission is a separate switch on each staff member's profile
- When enabled, each product line earns the product's own commission rate — not the staff member's service rate. A product with no rate of its own earns nothing
- When disabled, product sales still count as revenue but earn no commission
Total Commission: The sum of service commission + product commission (where enabled) for the selected date range.
Refunds, tips and commission: Revenue figures include sales that were later refunded (the sale was real income, with refunds tracked separately). Commission and tips are taken from completed transactions only — a refunded sale earns neither.
Note: Commission rates are set in each staff member's profile, and product rates on each product. See Tutorial 4.1 for setting up commission rates, and Tutorial 9.11 for a per-staff commission breakdown. Changes to rates only affect future transactions, not historical data.
Step 6: Reading the Performance Bar Chart
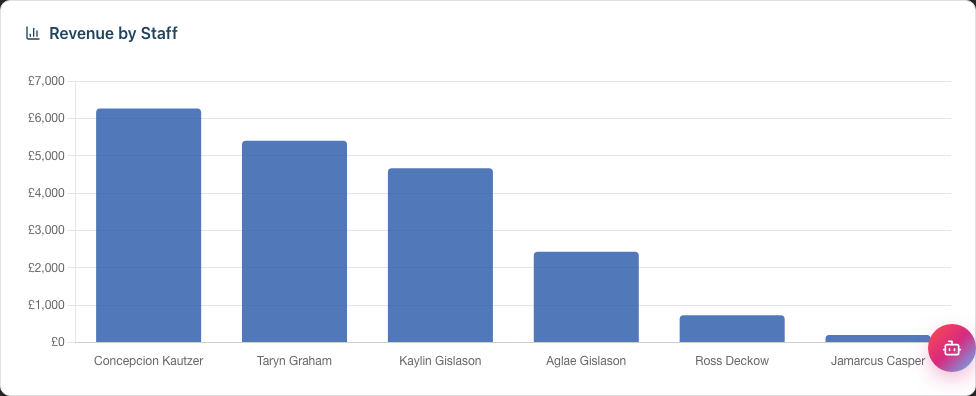
Above the table, the Revenue by Staff card shows a visual comparison of performance:
- Vertical bar chart with each staff member represented
- Bar height corresponds to total revenue
- Hover over any bar to see the exact figure
- Staff are ordered according to the current table sort
- The chart plots every staff member, even when the table below is split across pages
What to look for:
- A balanced team has bars of similar height
- Very short bars might indicate newer staff, part-time staff, or those focused on other duties
- Use this for quick visual comparisons across your team
Step 7: Viewing Individual Staff Details
To see more detail for a specific staff member:
Click on the staff member's name in the table
You'll be taken to their staff profile page showing:
- Contact Information
- Employment Details (role, hire date)
- Scheduling (staff level and working days)
- Compensation (commission rate and hourly rate)
- Leave — current allowance and usage
- Staff Status and Login Account
To return to the Staff Performance report, click Back to Staff Performance at the top of the profile. The link brings back the date range, sort order and page you left
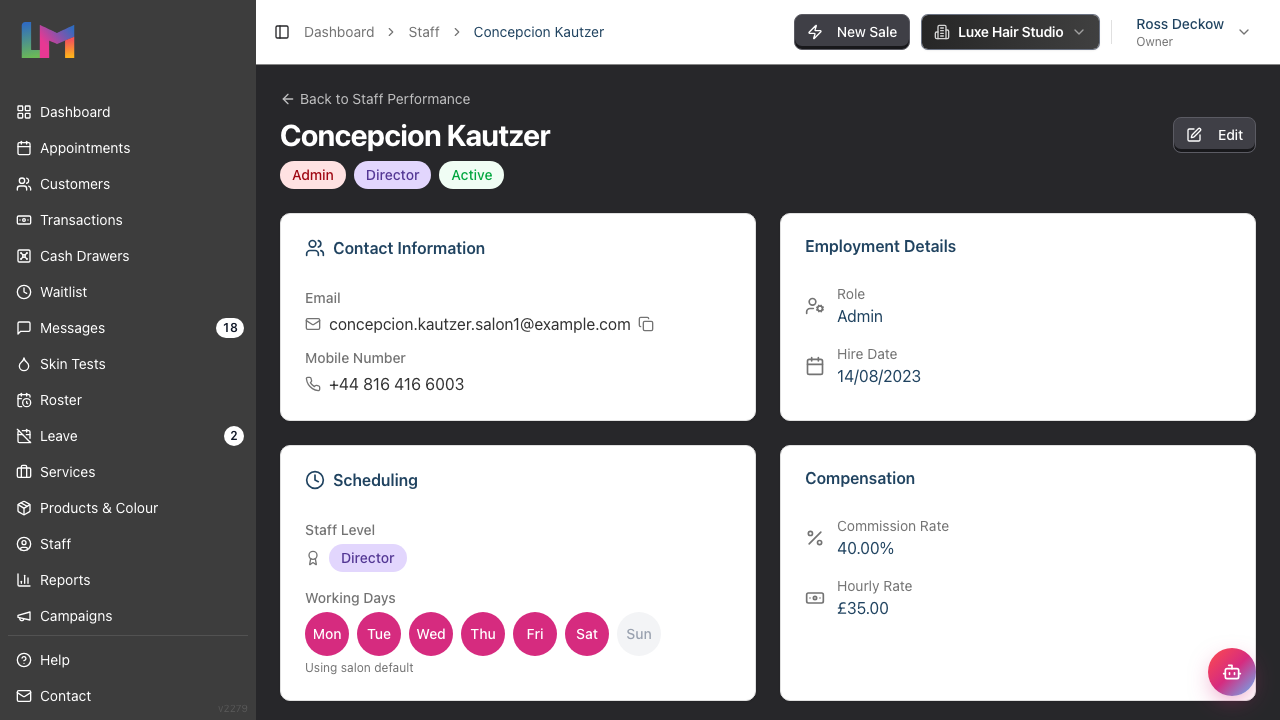
Note: The staff profile shows the team member's current settings rather than a performance breakdown. For a detailed per-staff commission breakdown (service vs product commission, item-by-item or tier progression), use the Staff Commission Report (Tutorial 9.11). For other transaction-level analysis, use the export feature and work in a spreadsheet.
Step 8: Exporting for Payroll
To export staff performance data:
- Set your desired date range (typically "Last month")
- Locate the Export button in the "Staff Breakdown" table header
- Choose your format:
- Export as CSV – Spreadsheet format for Excel or Google Sheets
- Export as PDF – Formatted document for printing or sharing
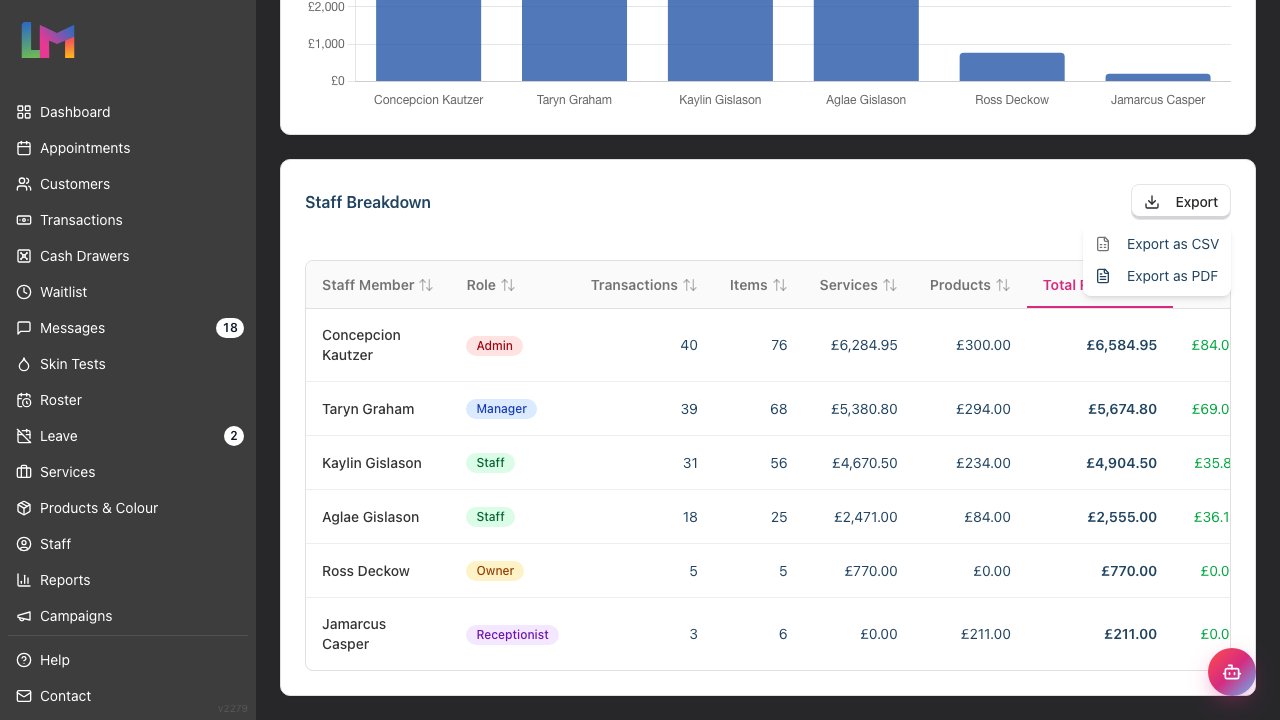
The export follows the sort you set on screen, so the rows come out in the order you were reading them.
CSV Export Contents:
- Staff name
- Role
- Transactions count
- Items count
- Service revenue
- Product revenue
- Total revenue
- Tips
- Commission
Using the export:
- Open in Excel or Google Sheets for calculations
- Use for payroll processing alongside base pay
- Import into your accounting or payroll software
- Keep as records for tax purposes
Note: Only Owners and Admins can export reports. The export button is not visible to Managers.
Common Pitfalls
"A staff member's revenue looks lower than expected"
Revenue is attributed to the staff member who performed the service or made the sale. If another team member processed the payment, the service provider still gets credit. Check that transaction items are assigned to the correct staff member.
"Commission isn't calculating correctly"
Start with the staff member's compensation type — salaried and hourly staff earn no service commission, and a salary-plus-commission staff member earns nothing until their tier bands are set. Then check the rates in their profile. Commission is captured at the time of the transaction, so the rate that was active when those sales were made is the one that counts. For products, check both that product commission is enabled for the staff member and that the product itself has a commission rate.
"I can't see all my staff members"
Only active staff appear in this report. Deactivate someone and their figures drop out of the report completely, including for past dates they worked — so a closed month's totals change. Export the report before you deactivate a leaver, and use the Payroll report (Tutorial 9.6) for their historical pay, which keeps leavers who worked or sold in the period.
"The total doesn't match my Daily Revenue report"
Three things can separate them. This report only counts service and product lines, so other charges (deposits, colour overage) don't appear here. It only counts lines with a staff member assigned. And it only counts staff who are still active. Daily Revenue counts the whole bill either way.
"Part-time staff appear to be underperforming"
Consider hours worked, not just total revenue. A part-timer working 2 days might have half the revenue of a full-timer on 5 days – but they could be performing equally well per hour. Use the Hours Worked report (Tutorial 9.7) alongside this one.
"Tips don't seem to be split correctly"
Tips are distributed proportionally based on each staff member's service revenue contribution to transactions. If one stylist performed 70% of the services on a bill, they receive 70% of the tip. Products are left out of the split, so a tip on a product-only sale isn't attributed to anyone.
Tips and Best Practices
- Review weekly with your team – Brief, regular reviews are more effective than monthly surprises
- Consider transactions, not just revenue – High revenue from few transactions might mean expensive services; many transactions with moderate revenue shows consistent booking
- Track trends, not just totals – Is someone improving or declining month-on-month?
- Set fair targets – Base targets on experience level, working hours, and typical client base
- Export before payroll – Always export and verify data before finalising payroll
- Look at the revenue per item – Divide Total Revenue by Items to see average ticket size per item sold
Related Tutorials
- Tutorial 9.11: Staff Commission Report – Per-staff commission breakdown (service vs product, item-level or tier progression)
- Tutorial 9.6: Payroll Processing and Reports – Complete payroll with base pay + commission
- Tutorial 9.7: Staff Hours Worked Report – Track actual hours alongside performance
- Tutorial 9.2: Running Revenue Reports – Overall salon revenue analysis
- Tutorial 4.4: Tracking Staff Performance and Commission – The same report from a staff-management angle
- Tutorial 4.3: Staff Levels and Experience Tiers – How tiered commission works
- Tutorial 4.1: Adding New Staff Members – Setting up commission rates
Frequently Asked Questions
Can staff see their own performance?
Staff members can see their personal dashboard with their own appointment schedule, but they cannot access the Staff Performance report. The full comparative view is only for Owners, Admins, and Managers.
How do I change a staff member's commission rate?
Go to Staff in the sidebar, click on the staff member, then Edit. The Compensation section holds the Compensation Type, the commission rate and the product commission switch. Changes apply to future transactions only.
Are tips included in the commission calculation?
No. Tips are tracked separately from service/product revenue. They're shown in their own column but don't affect commission calculations. Tips typically go directly to staff members.
What happens if a transaction is refunded?
The revenue from a refunded sale still appears in the performance figures — it was genuine income at the time, and refunds are tracked separately. Commission and tips, however, are taken from completed transactions only, so a refunded sale earns neither for the staff member.
Can I see performance by service type?
The Staff Performance report shows totals only. For service-type analysis, export the data and create a pivot table in your spreadsheet software, or check the Daily Revenue report which can show service breakdowns.
How far back does the performance data go?
All historical data from when you started using Luminate is available. There's no limit on how far back you can report.
Why can't I see the Export button?
Export is restricted to Owners and Admins only. If you're logged in as a Manager, you can view the report but cannot export. Ask an Owner or Admin to export for you if needed.
What's the difference between Transactions and Items?
Transactions count is how many separate transactions (bills) included this staff member's work. Items is the total number of services performed plus products sold. One transaction might have multiple items.
Last Updated: August 2026