
Colour Bar Performance Report
Introduction
Colour is usually a salon's biggest consumable cost and one of its biggest hidden margin leaks. The Colour Bar Performance report brings four questions into a single screen: how much extra colour you are billing, what the colour you use actually costs you, what margin the colour bar is making, and which colourist wastes the least. It is a financial review tool for owners and managers, not a day-to-day operational worklist.
This tutorial explains what each figure means, where it comes from, and how to use the per-colourist ranking to drive training conversations.
Who this is for: Owners, Admins, and Managers who review colour profitability and colourist performance.
What you'll learn:
- What "additional colour billed" is and when it is charged
- How colour cost and gross margin are worked out
- Why the report uses two different dates (billed vs finalised) and what that means
- What "waste %" measures and why it only counts re-weighed formulas
- How to read the reweigh-coverage indicator
- How to use the per-colourist ranking for training
- Who can view and who can export the report
Time to complete: 15 minutes
Prerequisites
Before you begin:
- Complete Tutorial 8.1 (Understanding Transactions and Payment Status)
- Your salon uses the Colour Bar feature (formulas are mixed and finalised in Luminate)
- For accurate waste figures, colourists re-weigh leftover product after services
Step-by-Step Instructions
Step 1: Accessing the Report
- Navigate to Reports in the sidebar
- Under Financial Reports, click Colour Bar Performance
The report opens with the last 30 days selected by default.
Step 2: Understanding "Additional Colour Billed"
Additional colour billed is the extra money you have charged customers for colour beyond what the service price already includes.
Many colour services are priced flat (for example, a root tint at a set price). When a client's hair needs more product than that price covers — long or thick hair, a full head where a regrowth was expected — Luminate can charge for the extra grams using a colour charge rule. That charge appears on the transaction as a separate "colour overage" line.
Key points:
- A charge is only created when the formula uses more product than the service includes and a charge rule is configured to bill for it.
- The amount shown is the actual amount charged to the customer — after the markup the rule applies, and after any discount on that charge line. It is the line total before tax. A discount applied to the sale as a whole, rather than to the colour line, is not reflected here.
- A charge only counts in this report once its transaction is completed. A charge sitting on a draft or pending sale does not appear yet.
- A refunded sale still counts. The cost was incurred and the sale happened, so the charge stays in the figures at its original amount — refunds are not netted off.
See also: Tutorial 20.8 (Overage Billing Explained) covers how charge rules decide what gets billed.
Step 3: Understanding Colour Cost and Gross Margin
Billed colour cost is what the colour you billed for actually cost the salon to buy. (The per-colourist table has a separate Colour Used (Cost) column that counts all colour mixed, billed or not — see Step 4.)
An important detail: colour cost is not a stored figure. Luminate does not keep a single "cost" number against each charge. Instead it is worked out from the as-charged breakdown — the per-product, per-gram costing that was recorded at the moment the charge was created. The report adds up the base cost of each product in that breakdown: cost per gram × the grams the rule charged for.
Which grams those are depends on the rule:
- An overage-only rule charges for the grams above what the service price includes, so the cost is the cost of those overage grams alone.
- A full-usage or per-gram rule charges for everything used, so the cost is the cost of all the product used.
Two more things follow from cost being derived:
- The cost shown is the cost as it was when you charged the customer, even if you later change a product's purchase price. Historical charges are never silently rewritten.
- If a charge has no stored breakdown, the report recalculates its cost live from the formula and flags the row as Recomputed (see Step 8).
Gross margin is simply billed minus cost. The summary also shows gross margin as a percentage (margin ÷ billed). This is the headline number for "is the colour bar making money".
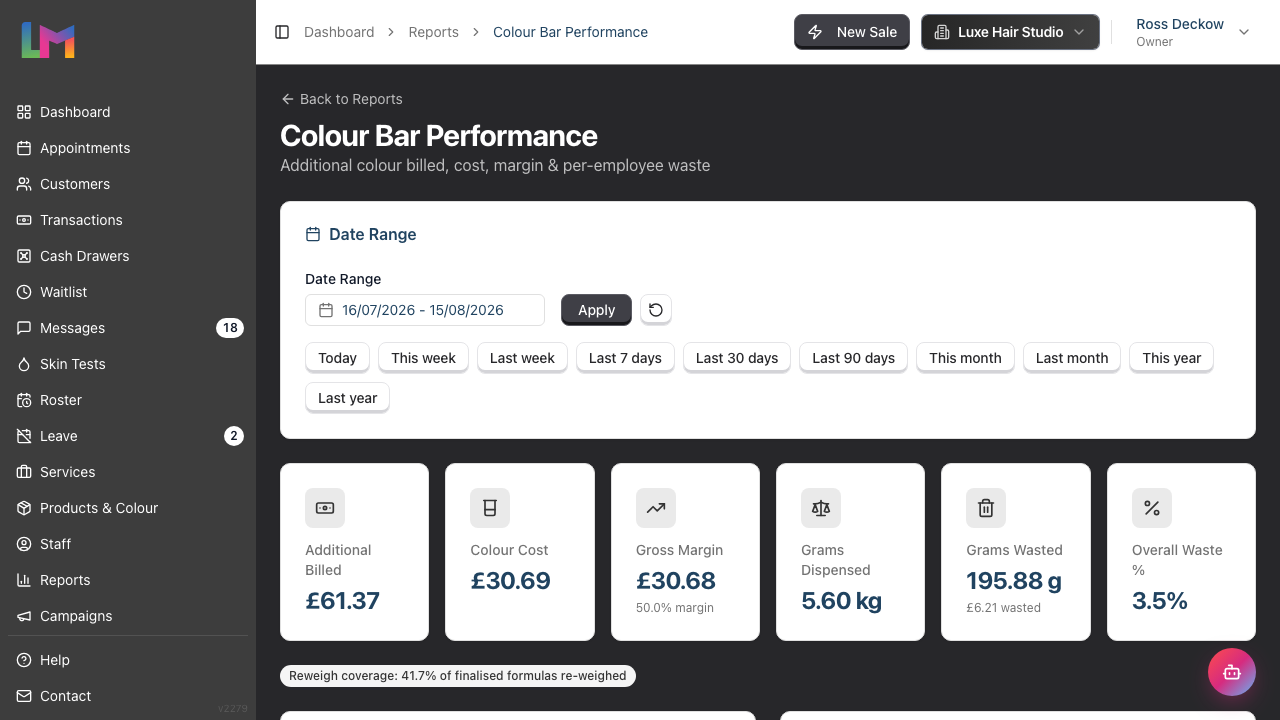
The summary cards across the top show:
| Card | Meaning |
|---|---|
| Additional Billed | Total extra colour revenue in the period |
| Billed Colour Cost | What the colour you billed for cost the salon (from the as-charged breakdown) |
| Gross Margin | Billed minus cost, with the margin percentage shown beneath |
| Grams Dispensed | Total product dispensed across finalised formulas |
| Grams Wasted | Total wasted product, with its cost shown beneath |
| Overall Waste % | Wasted grams as a percentage of the grams dispensed on re-weighed formulas |
Beneath the cards sits the reweigh-coverage chip (Step 6), and below that two charts: Additional Colour Billed by Day (a daily bar chart of extra colour revenue) and Waste % by Colourist (a bar chart comparing each colourist's waste percentage at a glance).
Step 4: Understanding the Two Date Anchors
This is the most important thing to understand about the report. It uses two different dates on purpose:
| Section | Dated by | Why |
|---|---|---|
| Billed, cost, margin | The date the transaction was completed | The money is recognised when the sale completes |
| Waste, dispensed, finalised counts | The date the formula was finalised | The product was consumed when the formula was finalised |
Because of this, a formula can appear in one table but not the other. A common example:
- A colourist finalises a formula on Monday (so it counts toward dispensed and waste for Monday), but the sale is saved as a draft and only completed on Wednesday (so the colour charge counts toward billed and margin for Wednesday).
If you pick a date range covering only Monday, you will see the waste from that formula but not its charge. If you pick only Wednesday, you will see the charge but not the waste. This is correct and intentional — each figure is dated to when it economically happened, not forced onto a single date.
The cards themselves do not say which date they use, so keep the table above in mind: the first three cards are money and follow the completion date; the last three are grams and follow the finalisation date. Over a month-long range the difference rarely matters. Over a single day it often does.
Step 5: Understanding Waste %
Waste % is the proportion of dispensed product that ended up binned, rather than going on the client's head.
Like cost, waste is never a stored figure. It is worked out at the time you run the report, by comparing two numbers recorded against each bowl:
- Dispensed grams — what came off the shelf when the formula was finalised (a fixed snapshot).
- Used grams — what was actually used, recorded when the colourist re-weighs the leftover product after the service.
Waste = dispensed − used. So:
Waste % is measured against re-weighed formulas only. A formula that was finalised but never re-weighed is left out of the calculation entirely — not counted as zero waste — because Luminate genuinely does not know how much was left over until someone weighs it.
That distinction matters. A colourist who never re-weighes shows no waste percentage at all, rather than a flattering 0%, and does not appear in the Waste % by Colourist chart. Their dispensed grams are still shown in full in the table; it is only the percentage that needs a measurement behind it.
One thing to know about that count: tapping No leftovers — used it all on the reweigh screen also marks the formula as re-weighed, with zero waste, because the colourist has declared that everything dispensed went on the head. That is a real answer, not a gap — but it means a colourist who taps it every time keeps 100% coverage and 0% waste without ever putting a bowl on the scale. See Tutorial 20.13 (Colour Bar: Weighing Leftovers).
This is why the next step — reweigh coverage — matters so much.
Step 6: Reading the Reweigh-Coverage Indicator
Directly beneath the summary cards, above the charts, is a reweigh coverage chip, for example:
Reweigh coverage: 41.7% of finalised formulas re-weighed
This tells you how much of your waste figure you can trust. Because only re-weighed formulas contribute waste:
- At high coverage (most formulas re-weighed), the waste % covers nearly all the work and is a reliable picture.
- At low coverage, the waste % is still accurate for the bowls that were weighed, but it only describes a small slice of what the salon actually did. The chip turns amber (warning) when coverage drops below 40%.
If there were no finalised formulas in the range, the chip instead reads "No finalised formulas in range".
The same indicator appears per colourist in the table as re-weighed (coverage %) (for example, 16 (89.0%)), so you can see who is consistently weighing their leftovers and who is not. That per-colourist figure also turns amber below 40% coverage. A colourist with very low coverage shows a waste % based on only a handful of bowls — read it alongside their coverage, and fix the habit before drawing conclusions. A colourist with no re-weighed bowls shows a dash rather than a number.
Tip: If you want to use waste figures for performance decisions, first get coverage high. Treat re-weighing leftover product as a standard part of every colour service.
Step 7: Reading the Per-Employee Waste Performance Table
The first table ranks colourists by waste, lowest waste first by default — so the top row is your benchmark.
| Column | Description |
|---|---|
| Colourist | The colourist who mixed the formula (click to view their staff page) |
| Finalised | Number of formulas they finalised in the period |
| Re-weighed | How many of those were re-weighed, with the coverage percentage in brackets |
| Dispensed (g) | Total grams dispensed |
| Used (g) | Total grams actually used (from re-weighing) |
| Wasted (g) | Total grams wasted (dispensed minus used) |
| Waste % | Wasted as a percentage of the grams dispensed on their re-weighed formulas. A dash means they re-weighed nothing, so there is no measurement to work from |
| Billed | Additional colour they billed |
| Colour Used (Cost) | What all the colour they mixed cost the salon, whether or not it was charged to a client |
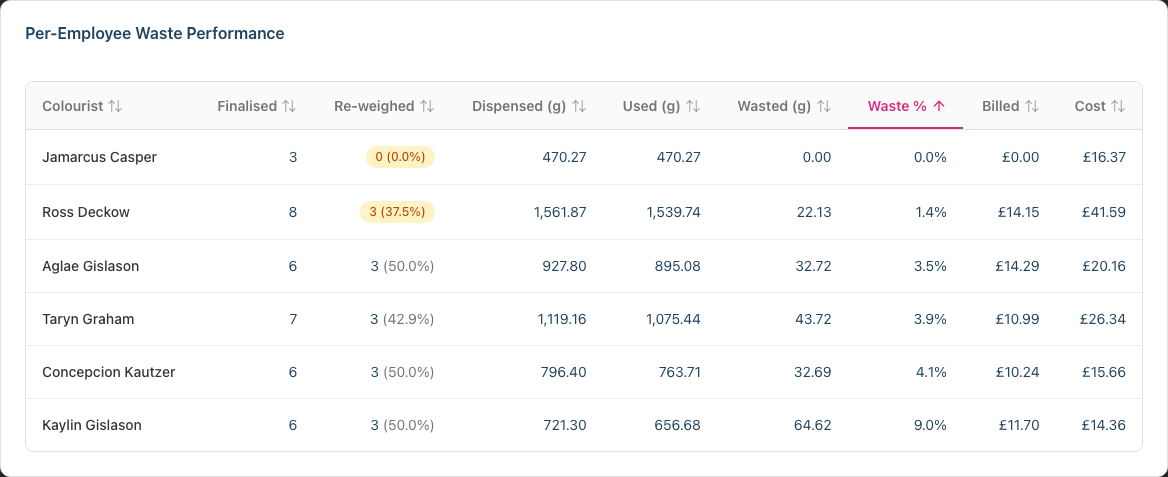
Notes on reading this table:
- Colour Used (Cost) will not add up to the Billed Colour Cost card. They answer different questions. The card counts only the colour you charged a client for; the column counts everything a colourist mixed, including colour that was used but never billed. The gap between them is colour going out of the door unpaid, which is usually the more interesting number of the two.
- Waste is attributed to the colourist who mixed the formula — the person accountable for the mix — not whoever happened to weigh the leftovers.
- A colourist who dispensed nothing at all in the period shows a No data badge for waste %. A colourist who dispensed product but re-weighed none of it shows 0.0% — check the amber coverage chip on the row before you read that figure (Step 6).
- A formula or charge with no colourist recorded rolls into an Unassigned row so the totals still add up. That row is a plain label, not a link to a staff page.
- Click any column header to re-sort. Rows with no waste data always sort to the bottom, regardless of direction. The columns in the second table are not sortable.
Using the ranking for training: A colourist at 4% waste and one at 21% waste, working similar volumes, is a clear technique signal worth real money. The report puts the lowest-waste colourist at the top deliberately, so it doubles as a benchmark. Use it to:
- Identify who to pair newer colourists with
- Spot a colourist whose waste has crept up
- Set a realistic waste target based on your own best performer, not an industry guess
Step 8: Reading the Additional Colour Billed Detail Table
The second table lists every committed colour charge in the period, one row each:
| Column | Description |
|---|---|
| Date | Date the transaction completed |
| Customer | Who was charged |
| Service | The colour service |
| Colourist | The staff member recorded on the charge line |
| Overage (g) | The grams the rule charged for |
| Rule | The colour charge rule used |
| Cost | Base cost of that colour |
| Charged | Amount charged to the customer |
| Margin | Charged minus cost |
| Basis | How the cost was costed (see below) |
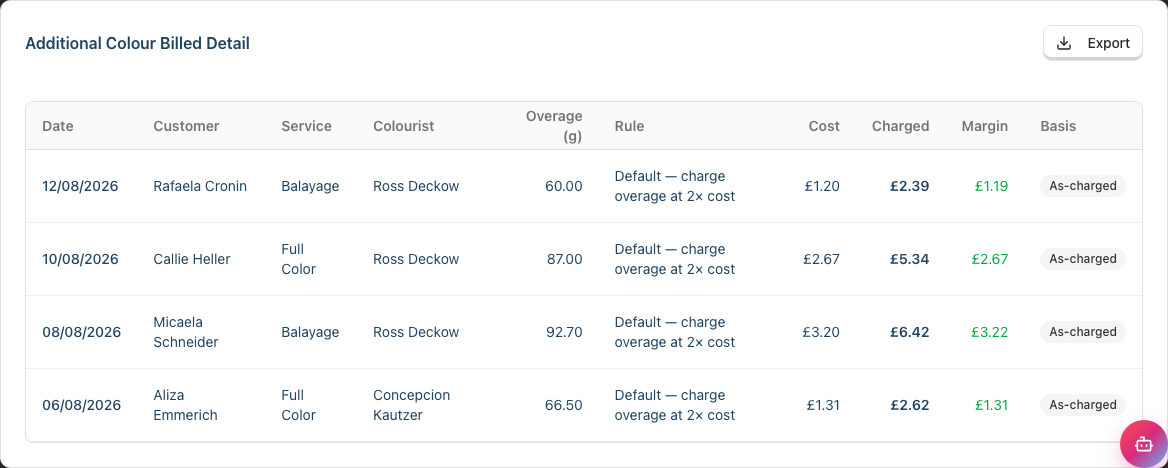
The Basis column tells you where each row's cost figure came from. Almost every row shows an As-charged badge — the cost was read from the breakdown stored when the charge was created. A row shows an amber Recomputed badge when the charge has no stored breakdown, so Luminate had to recalculate the cost live from the formula. A recomputed row uses today's product prices, not the prices in force when you charged the customer, so treat its margin as indicative.
Separately, when one or more products used in the period have no cost-per-gram on file (no purchase price or pack weight recorded), an amber chip appears next to the reweigh-coverage chip at the top of the report. Those products' grams are still counted, but their cost shows as zero, so the margin is overstated until you fix the product records.
This table shows 20 rows per page, with page controls beneath it when there are more.
Step 9: Filtering the Report
Use the Date Range card at the top:
- Click the Date Range field and pick a start and end date, or click one of the quick presets (Today, This week, Last week, Last 7 days, Last 30 days, Last 90 days, This month, Last month, This year, Last year)
- Click Apply
A preset applies straight away; a hand-picked range needs Apply. The whole report — summary cards, the coverage chip, both charts, and both tables — updates to the chosen range.
Remember the two-anchor rule from Step 4 when interpreting results: the date range filters billed figures by completion date and waste figures by finalisation date.
Use the reset button (the circular-arrow icon next to Apply) to return to the default range and the default sort.
Step 10: Exporting the Report
To export:
- Open the Colour Bar Performance report
- Apply the date range you want included
- Click the Export button in the detail table header
- Choose your format:
- Export as CSV — for spreadsheets or accounting software
- Export as PDF — formatted for printing or sharing

The export stacks both tables — the per-employee performance block followed by the billed detail block — into one file, named with the date range (for example, colour-bar-performance-2026-06-01-to-2026-06-30.csv).
Two things the export does that the screen does not:
- It includes every billed charge in the range, not just the page you are looking at.
- The PDF adds a footnote restating the coverage figure and the missing-cost warning, so whoever reads the printout gets the same honesty rails you see on screen.
Note: Managers can view this report but cannot export it — the Export button does not appear for them at all. See Step 11.
Step 11: Colour Bar Performance Permissions
| Action | Owner | Admin | Manager | Staff | Receptionist |
|---|---|---|---|---|---|
| View Colour Bar Performance report | ✓ | ✓ | ✓ | ✗ | ✗ |
| Export the report | ✓ | ✓ | ✗ | ✗ | ✗ |
This matches the other Financial Reports: managers get view access for operational review, but exports (which take data off the system) are restricted to Owners and Admins. Staff and Receptionists who follow a direct link get a 403 Access denied page. There is no colourist self-view of their own waste at this time.
Common Pitfalls
"A colourist's waste % looks too good to be true"
Check their reweigh coverage. If they have only re-weighed 2 of 15 formulas, their waste % is based on those 2 only and is not meaningful. A colourist who has re-weighed nothing shows a flat 0.0% and sorts to the top of the table — the amber coverage chip on the row is what tells you to ignore it. Get coverage up before trusting the figure.
"Margin on the row looks fine, but the Cost column is bigger than Billed"
The Cost column also counts colour used on formulas that were never billed for overage, so a colourist can show cost with no matching billed figure. Read the column as "what their colour cost the salon", not as the cost side of their billed margin. The Colour Cost summary card is the narrower figure — the cost behind the billed charges only — so the column will not add up to the card.
"A charge I expected isn't in the report"
The charge only appears once its transaction is completed. If the sale is still a draft or pending, complete it first. Also check the date range — the charge is dated by completion date, which may differ from the appointment date.
"Waste shows for a formula but the charge doesn't (or vice versa)"
This is the two-anchor behaviour from Step 4. Waste is dated by finalisation, billing by completion. Widen your date range to see both, or accept that a formula straddling a period boundary will appear split.
"Margin on a row looks too high"
Check for the amber missing cost basis chip at the top of the report. If a product has no purchase price or pack weight recorded, its cost shows as zero and the margin is overstated. Fix the product record so the cost-per-gram can be calculated. Tutorial 20.4 (Setting Up Colour Products) covers the two fields involved.
"Colour cost changed but the report still shows the old cost"
This is intentional. Billed charges keep their as-charged cost so historical margin is accurate. Changing a product's price affects future charges, not past ones.
Tips and Best Practices
Get coverage high first — Waste figures are only as good as your reweigh coverage. Make re-weighing leftover product a standard step in every colour service.
Review monthly — Colour margin and waste trends are best seen over a month, not a day.
Benchmark internally — Use your lowest-waste colourist as the target, not a generic industry figure.
Watch the margin percentage — If gross margin % is falling, check whether your charge rules still reflect current product costs.
Fix products flagged with no cost basis — A product missing its purchase price or pack weight distorts both cost and margin. Clear these flags promptly.
Pair on technique — Use the ranking to pair high-waste colourists with low-waste ones for hands-on training.
Mind the two dates — When reconciling against revenue reports, remember billing is dated by completion and waste by finalisation.
Related Tutorials
- Tutorial 8.1: Understanding Transactions and Payment Status
- Tutorial 8.2: Handling Refunds and Cancellations - How refunds affect colour charges
- Tutorial 8.5: Managing Outstanding Balances - Another Financial Report
- Tutorial 9.12: Colour Stock & Reorder Report - The stock side of the colour bar
- Tutorial 20.4: Setting Up Colour Products - Where cost-per-gram comes from
- Tutorial 20.8: Overage Billing Explained - How charge rules decide what to bill
- Tutorial 20.13: Colour Bar: Weighing Leftovers - Where the waste figures come from
Frequently Asked Questions
Why are billing and waste dated differently?
Because they happen at different times. Product is consumed when the formula is finalised; money is recognised when the sale completes. Dating each to when it economically happened keeps both figures honest, even though it means a formula can appear in one table and not the other.
Why does a finalised formula show zero waste?
Because it has not been re-weighed. Until a colourist weighs the leftover product, Luminate cannot know how much was wasted, so it records zero rather than guessing. Re-weighing fixes this.
Is colour cost a stored number?
No. It is calculated from the as-charged breakdown that was recorded when the charge was created (or recalculated live when a charge has no stored breakdown). This is why historical costs stay fixed even after you change product prices.
Why does the Cost column not add up to the Colour Cost card?
They count different things. The card is the cost behind the billed charges. The column also includes the cost of colour used on formulas that were never billed for overage, so it is usually the larger figure. The Billed column and the Additional Billed card do match.
Does tapping "No leftovers — used it all" count as a re-weigh?
Yes. It records that everything dispensed went on the head, so the formula counts as re-weighed with zero waste and lifts your coverage figure. It is an honest answer when the leftover really is gone, but it is not a measurement — see Tutorial 20.13.
Why can managers view but not export?
Exports take data off the system, so they are restricted to Owners and Admins, consistent with the other Financial Reports. Managers still get full view access for review.
Do refunded colour charges still appear?
Yes, at their original amount. The cost was still incurred and the original sale happened, so refunded charges remain visible rather than disappearing from the cost picture. The billed figure is not reduced by the refund.
Can a colourist see their own waste?
Not currently. The report is for managers and above. A colourist self-view is not part of this report.
Last Updated: August 2026