
Monthly Reporting and Review
Introduction
Monthly reviews provide the bigger picture that daily and weekly tasks can't show. Trends become visible, seasonal patterns emerge, and you can make informed decisions about your salon's direction. This guide covers the essential monthly checklist for comprehensive business analysis.
Taking time each month to analyse your salon's performance helps you understand what's working, identify areas for improvement, and set meaningful goals for the coming weeks.
Who this is for: Owners and Admins responsible for business performance and strategy.
What you'll learn:
- Running and analysing all key reports
- Comparing performance to previous months
- Reviewing staff commission and payroll
- Analysing customer retention trends
- Tracking revenue patterns
- Processing monthly payroll
- Setting goals for the next month
Time to complete: 1-2 hours (recommended: schedule at the start of each month)
Prerequisites
Before you begin, make sure you have:
- Access to Luminate with Owner or Admin permissions
- The previous month's data fully entered (all transactions completed, cash drawers closed)
- Time blocked for uninterrupted analysis
- Access to any external financial records for comparison
Step-by-Step Instructions
Step 1: Run the Daily Revenue Report for the Month
Start with an overview of your revenue performance.
- Click Reports in the sidebar menu
- Under Financial Reports, select Daily Revenue
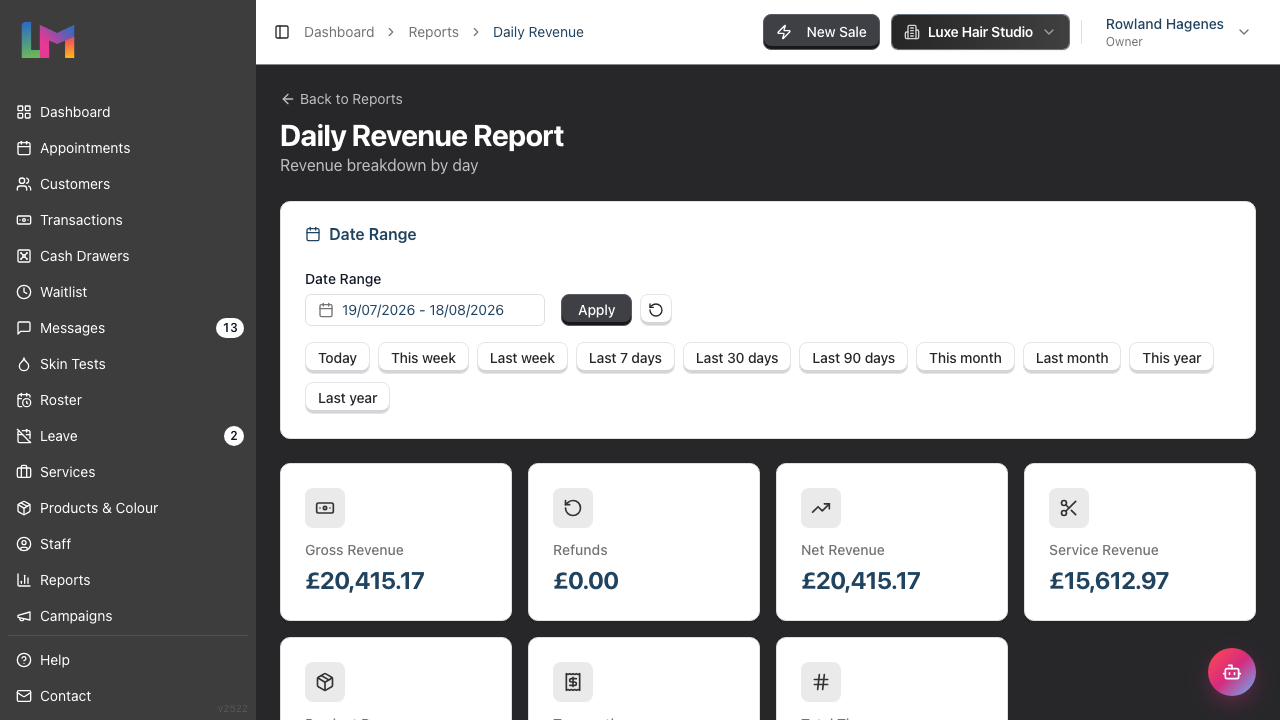
- On the Daily Revenue Report page, click Last month in the Date Range card
The report reloads straight away. Each preset applies itself, so you don't need to click Apply after one.
The Date Range card also offers Today, This week, Last week, Last 7 days, Last 30 days, Last 90 days, This month, This year and Last year. For any other period, open the Date Range field, pick your start and end dates, then click Apply. Every report in this guide uses the same card, so these presets work the same way throughout.
Review the summary metrics:
The summary cards across the top break revenue down so you can see exactly where it came from:
| Metric | What It Tells You |
|---|---|
| Gross Revenue | Total income before refunds |
| Refunds | Total refunded during the period |
| Net Revenue | Income after refunds — your true takings |
| Service Revenue | Income from services |
| Product Revenue | Income from retail products |
| Transactions | How many sales were processed |
| Total Tips | Additional income from tips |
Gross Revenue is what your customers were charged, tax included. Service Revenue and Product Revenue are the line totals before tax and before discounts, so those two won't add up to Gross Revenue on their own. Add the tax back on and they will.
Analyse the Revenue Trend chart:
- Look for patterns (busy days vs quiet days)
- Identify any unusually low or high days
- Note weekend vs weekday performance
Review the Daily Breakdown table: Below the chart, the Daily Breakdown table lists each day with its Transactions, Services, Products, Subtotal, Discounts, Tax, Revenue, Refunds and Tips. Revenue is the amount charged that day — Subtotal less Discounts, plus Tax. Click a column heading to sort by it.
Compare to previous months:
- Click Last year to see the same twelve months a year earlier, or set the date range by hand for the same month last year
- Click This month and Last month to spot short-term trends
- Look for growth or decline patterns
Export the data: In the Daily Breakdown card header, click Export and choose Export as CSV or Export as PDF to download the report for:
- Your accountant
- Further analysis in a spreadsheet
- Monthly business records
The PDF opens with a summary block of Gross Revenue, Refunds, Net Revenue, Transactions, Average Transaction and Total Tips, then the same day-by-day table. Average Transaction is the one figure the PDF gives you that the screen doesn't. The CSV carries the same day-by-day columns, Refunds included, so both files reconcile against the cards on screen.
If you file a tax return, run the tax report for the same period as well. It sits under Financial Reports and is named after your salon's tax label — VAT Report, GST Report, and so on. It gives you tax collected, net sales and gross sales in the shape a return asks for. See Tutorial 9.8.
Step 2: Analyse Staff Performance and Commission
Understand how your team performed and calculate earnings.
- Click Reports in the sidebar menu
- Under Staff Reports, select Staff Performance
- On the Staff Performance Report page, click Last month
Review the summary cards:
- Total Revenue - combined revenue generated by the team
- Avg per Staff - average revenue per staff member
- Total Tips - tips received across the team
- Total Commission - commission earned across the team
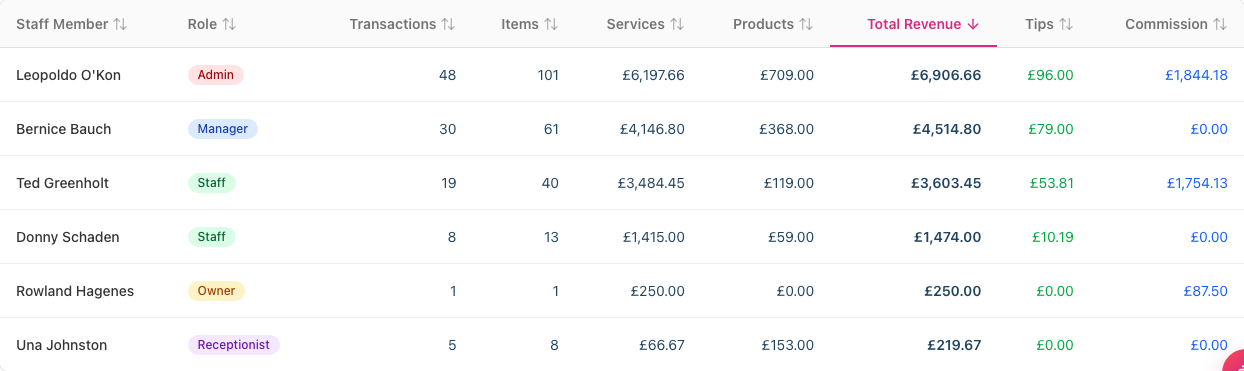
This report counts revenue before tax, so its Total Revenue is lower than the Gross Revenue you read in Step 1. Compare staff with each other here, and use the Daily Revenue report for the salon's takings.
The Revenue by Staff chart ranks staff members visually so top performers stand out at a glance.
Review individual staff metrics: The Staff Breakdown table shows, for each person: Staff Member, Role, Transactions, Items, Services, Products, Total Revenue, Tips and Commission. Click a column heading to sort.
Questions to consider:
- Who were your top performers?
- Are there significant gaps between staff members?
- Does performance correlate with hours worked?
- Are commission rates appropriate for experience levels?
Track hours worked:
- Go to Reports and, under Staff Reports, select Hours Worked
- On the Hours Worked Report page, click Last month
- The summary cards show Total Working Hours, Staff Members, Avg Hours/Staff and Total Shifts; the Staff Hours Breakdown table lists each person's Role, Shifts, Scheduled Hours, Working Hours and Break Hours
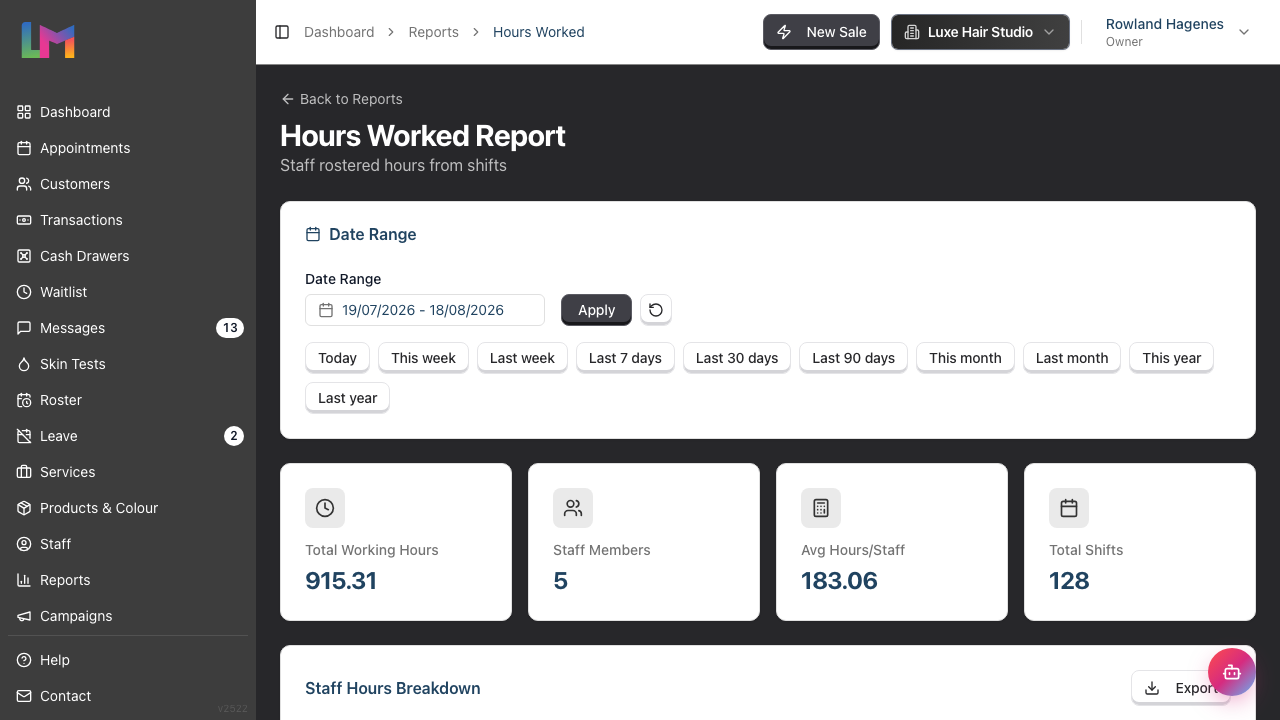
This report shows hours actually worked. It takes approved leave off the roster, so a stylist who took a week's holiday shows fewer shifts and fewer hours here than their roster pattern would suggest. Working Hours is Scheduled Hours less Break Hours.
Calculate productivity:
- Compare revenue per hour worked
- Identify if some staff are more efficient
- Consider whether roster adjustments are needed
Step 3: Review Staff Payroll
Process monthly payroll by reviewing all compensation components.
- Click Reports in the sidebar menu
- Under Staff Reports, select Payroll
- Use the month dropdown at the top of the page to choose the previous month
- If the month you picked is marked (not generated), click Generate followed by that month's name
Generating builds the period from the roster and the month's transactions. A badge beside the page title shows whether the period is Draft or Finalised. A draft recalculates every time you open it, so it always reflects the latest figures.
The payroll report shows:
- Total Staff - Number of staff members in the period
- Total Revenue - Revenue generated by staff
- Base Pay - Calculated from rostered hours and pay rates
- Commission - Based on services/products sold
- Tips - Received during the period
- Total Gross Pay - Combined compensation for all staff
For each staff member, the table displays:
- Staff Member - Name of the employee
- Type - Compensation type (Hourly, Salary, Commission Only, etc.)
- Hours - Scheduled hours vs actual hours worked
- Revenue - Total revenue generated
- Base Pay - Calculated from hours and rate
- Commission - Earned commission amount
- Tips - Tips received
- Adjustments - Any manual adjustments (positive or negative)
- Gross Pay - Base pay, commission and tips added together
- Net Pay - Gross pay plus or minus any adjustments
Net Pay is what the person has earned. It isn't take-home pay: Luminate doesn't calculate tax or any other statutory deduction, so your payroll provider works those out from these figures.
Payroll pays the roster. Hours here are the shifts the person was rostered for, including days they were on approved leave, which is why the figure can be higher than the Working Hours in the Hours Worked report from Step 2. Both are correct: one is what you pay, the other is time on the floor.
For each staff member, verify:
- Hours look correct based on the roster
- Commission is calculated correctly per their structure
- Tips are recorded accurately
- Any adjustments are appropriate
While the period is Draft you can correct it. Click the pencil beside a person's Hours to set actual hours, or the pencil beside Adjustments to add or take off an amount with a note. Recalculate refreshes the figures from the roster and transactions, and keeps any correction you made. When you're happy, Finalise locks the period. Tutorial 9.6 covers the whole payroll cycle in detail.
Export for processing: Click Export at the top of the page to share the figures with your payroll provider or accountant. This provides a clear breakdown of each staff member's earnings.
Note: Payroll periods run to the calendar month by default. If your salon pays to a different cycle, set it under Salon Settings > Staff > Payroll, where the Payroll Period card lets you choose a start day between the 2nd and the 28th. A period then runs from that day to the day before it in the following month, and is labelled by the month it ends in. Use Custom period on the Payroll report to build a one-off period with your own dates, which is useful for bridging a gap after you change the cycle.
Step 4: Review Leave Usage and Allowances
Track leave taken and plan for upcoming needs.
- Click Reports in the sidebar menu
- Under Staff Reports, select Leave Report
- Use the Year dropdown to choose the year to review
- Review annual leave usage across your team
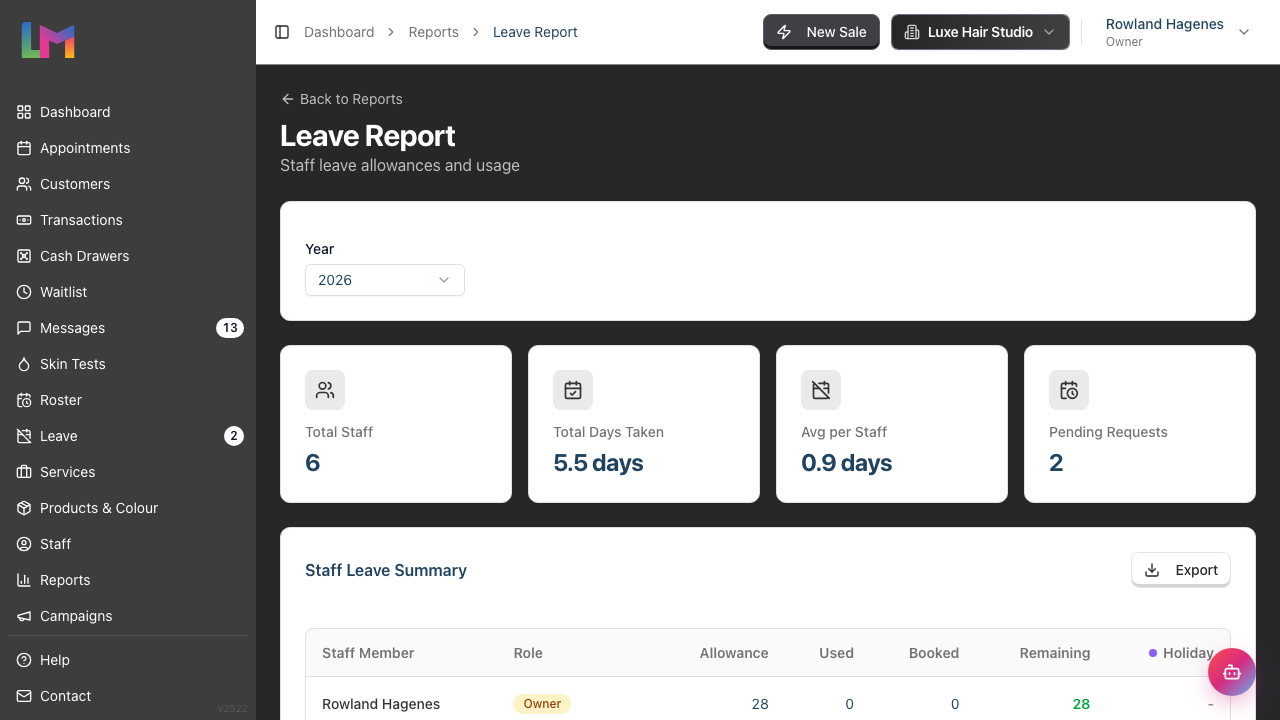
The summary cards show:
- Total Staff - Number of staff members
- Total Days Taken - Leave days used across all staff
- Avg per Staff - Average days taken per person
- Pending Requests - Leave requests awaiting approval
In the Staff Leave Summary table, each staff member has:
- Role - Their role in the salon
- Allowance - Total leave days allocated for the year
- Used - Days of approved leave already finished
- Booked - Days of approved leave still to come
- Remaining - Allowance less Used less Booked
- A column for each leave type that comes off the allowance, such as Holiday
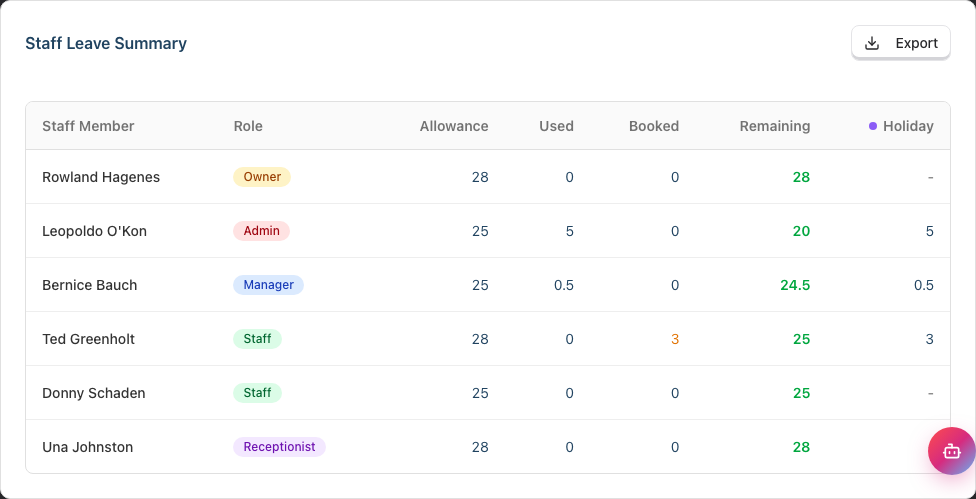
Leave types that don't come off the allowance — Sick, Unpaid and the rest — get no column here. The Leave Types card below the table lists every type your salon uses and marks the ones that deduct.
Booked and Pending Requests answer different questions, so expect them to differ. Booked is leave a manager has already approved. Pending Requests is requests still waiting for a decision, and those don't touch anyone's balance until they're approved.
For each staff member, note:
- Days taken vs allowance remaining
- Any patterns in leave usage
- Staff approaching exhausted allowances
- Staff with significant unused leave
Year-end planning: The Year dropdown follows your salon's leave year, which may not start in January. As your leave year nears its end, pay special attention to:
- Staff with large unused balances
- Your carryover policy and limits
- Encouraging staff to use leave before the year closes
Tutorial 6.4 covers the leave year, carryover and this report in full.
Step 5: Analyse Customer Metrics
Understanding customer behaviour helps with marketing and service decisions.
- Click Reports in the sidebar menu
- Under Customer Reports, select Top Customers
- Click Last month, or set the date range to the period you want to review
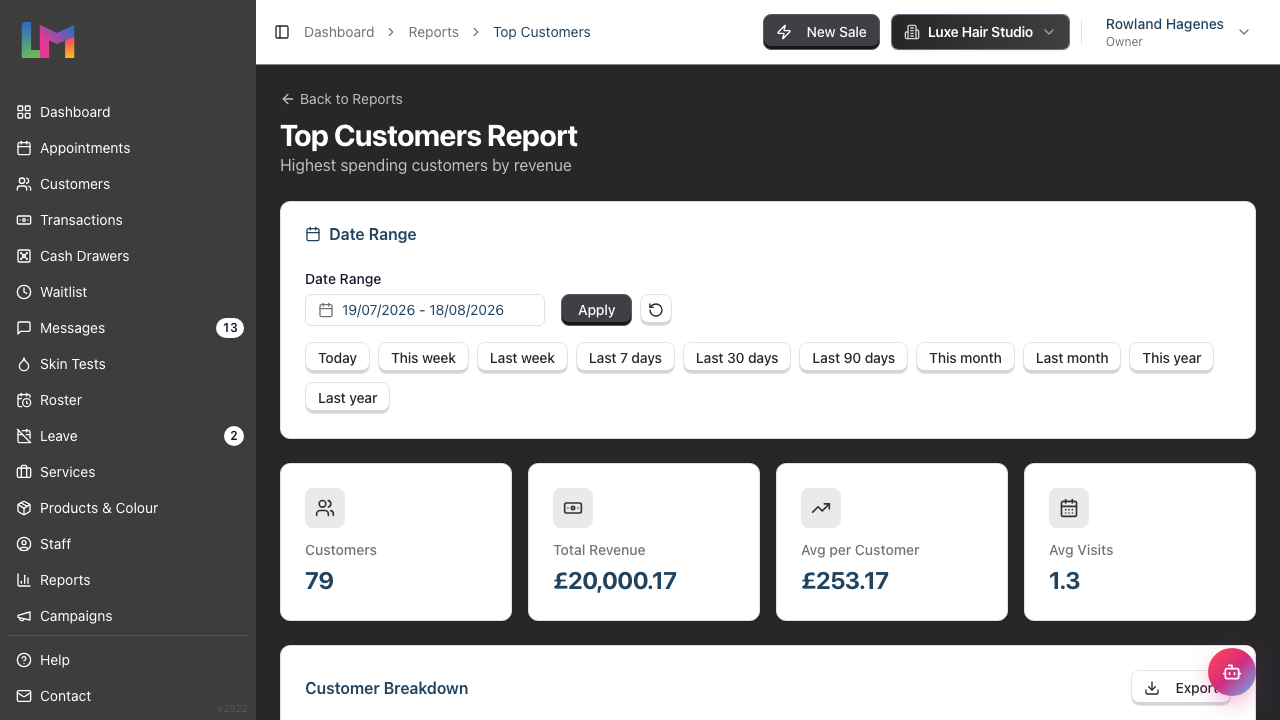
The report displays:
- Customers - How many customers spent money in the period
- Total Revenue - Combined revenue from those customers
- Avg per Customer - Average spending per customer
- Avg Visits - Average number of visits
In the Customer Breakdown table, each customer has:
- Customer - Their name, linking to their full record
- Email and Phone - Contact information
- Visits - Sales recorded for them in the period
- Total Spend - What they spent in the period
- Avg per Visit - Average transaction value
- Last Visit - Their most recent sale in the period
Every figure here covers the date range you selected, not the customer's whole history. Set the range to This year or Last year for a longer view.
Top customers analysis:
- Who are your VIPs?
- How much do they spend?
- How often do they visit?
- When did they last visit (are they due for an appointment)?
Customer retention: On the dashboard, open the Analytics tab (the dashboard opens on Today's Appointments) and check the Re-Booking chart. The percentage in the middle is the share of customers who completed an appointment in the period and have another appointment booked after it. Ask yourself:
- How many customers are leaving with nothing in the diary?
- Is the rebook rate improving or declining?
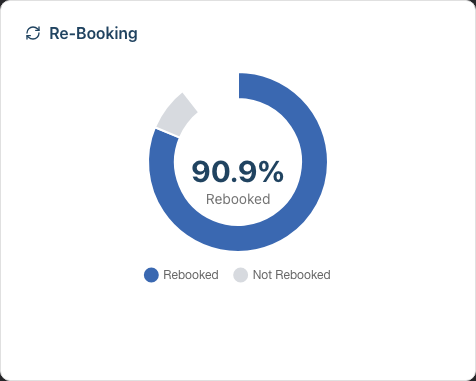
The Analytics tab opens on the current week. For a monthly view, click This Month, then the back arrow to step to the month you're reviewing. Everything on the tab moves with it: the Sales card, which compares the period against the one before it, the Re-Booking chart, the Operators table with a Rebook Rate per staff member, and the Revenue Trend chart.
New vs returning customers: Note the balance between new customer acquisition and returning customer loyalty. A healthy salon has both.
Step 6: Review Accounts Receivable
Monthly review of outstanding balances helps maintain cash flow.
- Click Reports in the sidebar menu
- Under Financial Reports, select Accounts Receivable
- Review the complete list of outstanding amounts
Review the summary cards:
- Total Outstanding - the total amount owed to you
- Customers with Balance - how many customers owe money
- Average Balance - average amount owed per customer
- Oldest Overdue - the age of the oldest overdue balance
Narrow the list with the Filters card:
- Min Balance - hide small balances below a threshold
- Days Overdue - show only balances older than 7, 14, 30, 60 or 90+ days
- Unpaid Invoices - show only customers with multiple unpaid invoices (2+, 3+, 5+)
Click Apply to update the results.
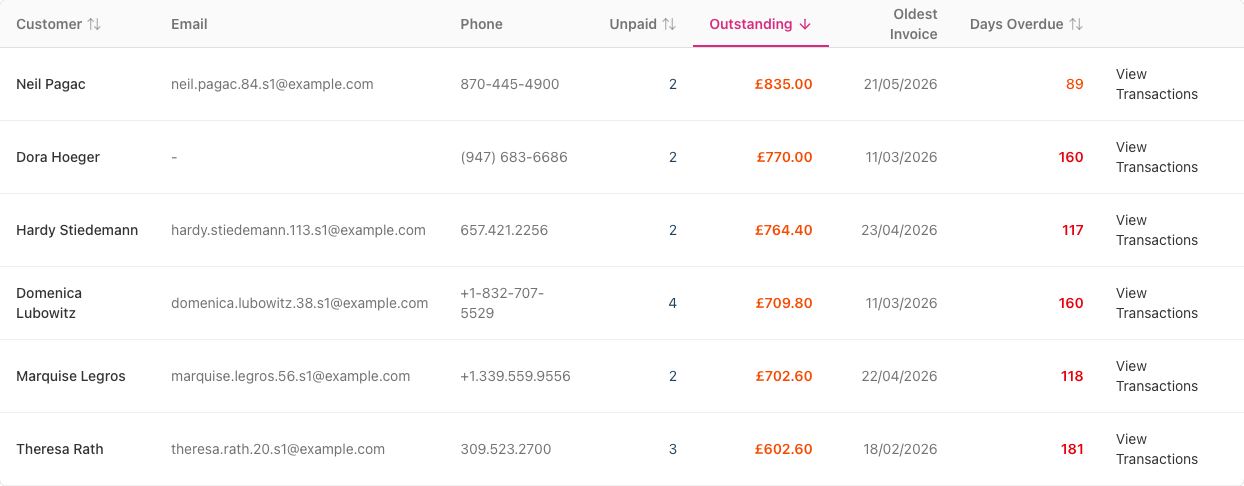
Read the Outstanding Balances table: For each customer the table shows Customer, Unpaid (number of unpaid invoices), Outstanding (amount owed), Oldest Invoice and Days Overdue. On a wide screen you also get Email and Phone; on a laptop those two are dropped so the aging figures stay in view. Use the Days Overdue column (or the filter) to build an informal aging picture:
- 0-30 days - Recent and likely to be collected
- 31-60 days - Follow up needed
- 61-90 days - Significant concern
- 90+ days - Consider write-off
Click View Transactions on a row to see that customer's outstanding invoices in detail.
Monthly actions:
- Send reminder messages to customers with 30+ day balances
- Discuss write-off candidates with your accountant
- Document collection efforts for records
- Consider adjusting deposit policies for problematic customers
Step 7: Check Gift Voucher Liability
Gift vouchers create a financial obligation. Monthly tracking is essential.
- Click Reports in the sidebar menu
- Under Financial Reports, select Gift Vouchers
- Set a range in the Issue Date Range card and click Apply, or click All time to see every voucher you have ever issued
The report opens on All time, which is what you want for a liability check: a voucher issued three years ago is still money you owe.
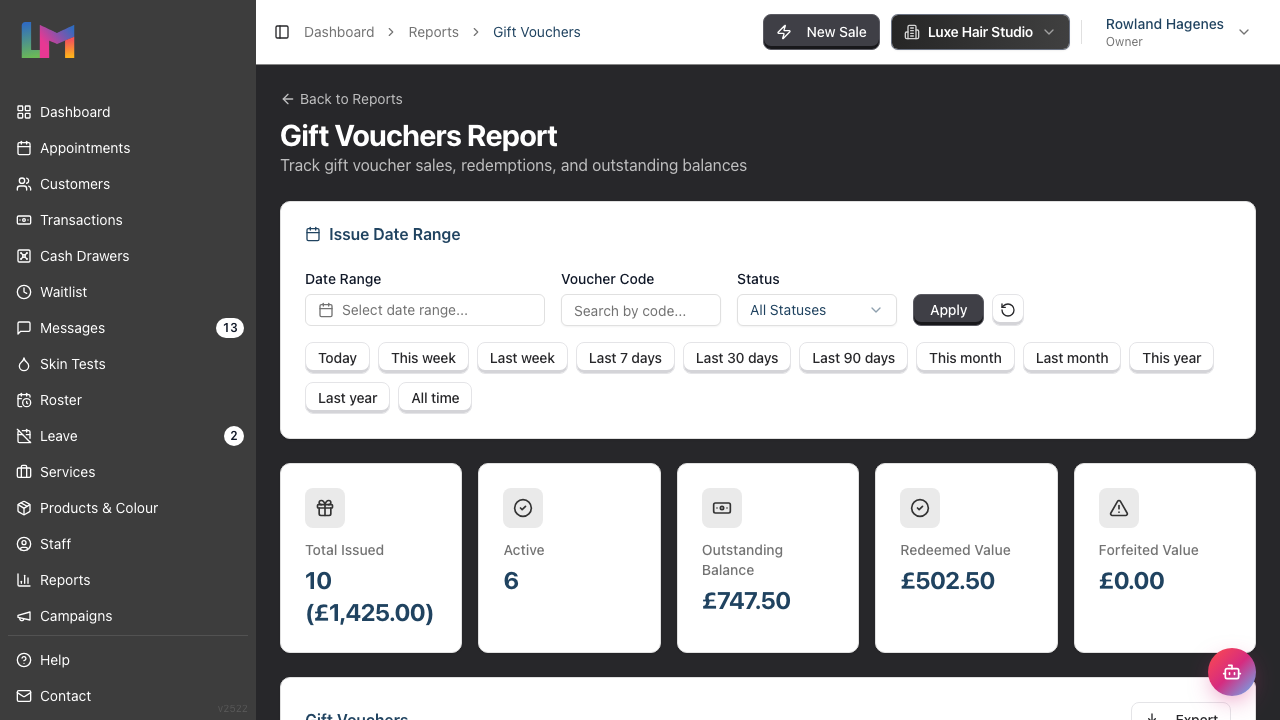
Review the summary cards:
- Total Issued - count and value of vouchers issued
- Active - vouchers still in use
- Outstanding Balance - your total voucher liability (money owed in unredeemed vouchers)
- Redeemed Value - value redeemed
- Forfeited Value - value lost to expiry or voiding
Read the Gift Vouchers table: Each row shows Code, Status, Customer, Recipient, Initial Value, Balance, Forfeited, Issued and Expires. Use the Voucher Code search and the Status filter (All Statuses, Active, Redeemed, Expired, Voided) to focus on what you need.
Track month-over-month:
- Is your Outstanding Balance growing?
- Are vouchers being redeemed or sitting unused?
- How much value is being forfeited?
Expiring vouchers: Sort by the Expires column (or filter by Status) to spot vouchers nearing expiry. Consider:
- Customer contact campaigns
- Promotional reminders
- Policies around extensions
Vouchers are one of two liabilities on your books. The other is account credit, so run Account Credit under Financial Reports while you are here — it shows the credit your customers are holding and every movement in and out of it.
Step 8: Review SMS Usage and Credits
If you use SMS for communications, track your usage.
- Click Reports in the sidebar menu
- Under Messaging Reports, select SMS Usage
- Click Last month
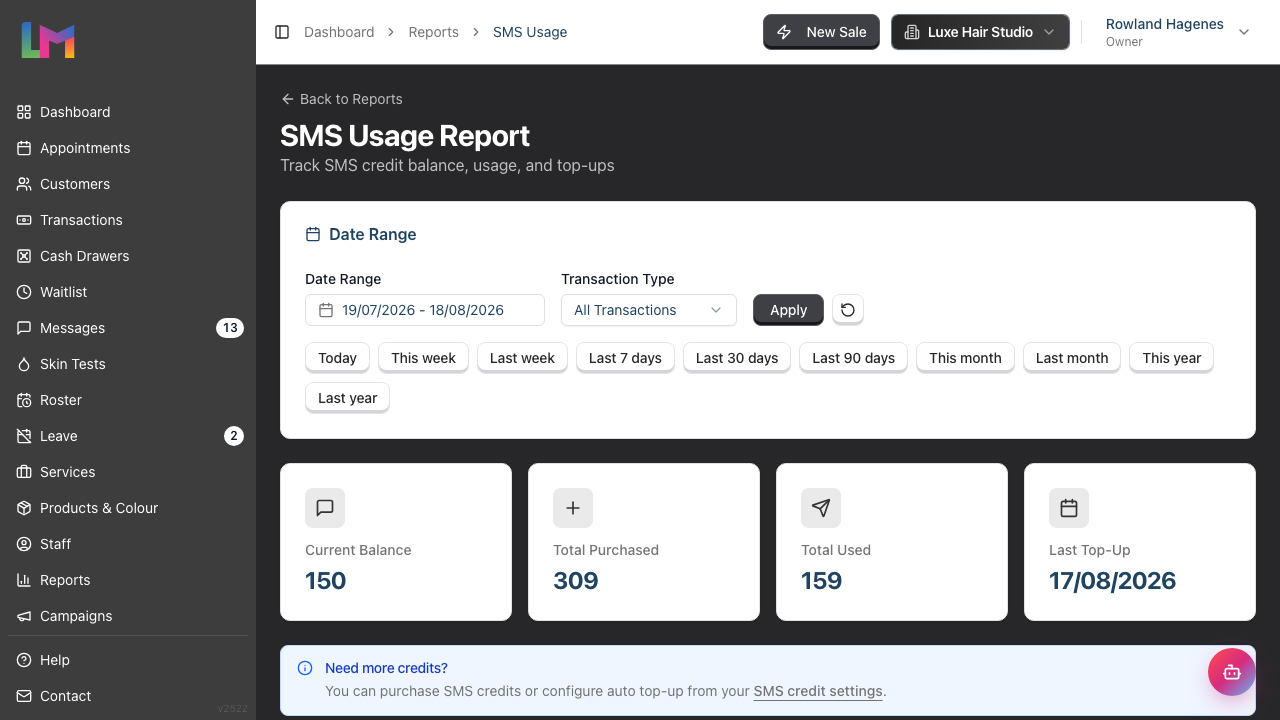
The summary cards show:
- Current Balance - SMS credits available right now
- Total Purchased - Credits you have bought since the account opened
- Total Used - Credits you have spent since the account opened
- Last Top-Up - Date of your most recent credit purchase
These four cards report your account as a whole, so they don't change when you change the date range. For the month's own figures, read the tables and the chart below them.
The Usage Trend chart shows daily SMS consumption for the selected range, helping you identify busy periods and plan for future needs.
Switch between the two views:
- Individual Entries - the Transaction History table, listing each credit movement with its Date, Type, Reason, SMS Type, Amount, running Balance and the Customer it went to
- Daily Summary - the Daily Breakdown table, showing Credits Added, Credits Used, Net Change and Transactions per day
Use the Transaction Type filter beside the date range to narrow either view to Usage Only, Top-Ups Only or Adjustments.
Running low? The Need more credits? panel links straight to your SMS credit settings, where you can buy credits or set up auto top-up.
Monthly tracking:
- How many SMS messages were sent? (Add up Credits Used in the Daily Summary view)
- Is usage increasing or decreasing?
- Do you need to top up before the next month?
- What types of messages are being sent? (Check the SMS Type column in the Individual Entries view)
Optimising SMS usage:
- Review which notification types use SMS (appointment reminders, birthday messages, cancellations, etc.)
- Consider if email could work for some messages
- Ensure reminders are generating ROI (fewer no-shows)
Step 9: Compare Year-over-Year Performance
If you have historical data, compare with the same month last year.
- Open the Daily Revenue report and set the Date Range to the same month last year
- Compare key metrics:
- Revenue growth percentage
- Transaction count changes
- Average transaction value changes
The Last year preset gives you the whole of last year in one go, which is a quick way to see whether this month is holding its share of the year. For a month-on-month comparison you don't have to work out yourself, the dashboard's Analytics tab shows a percentage change against the previous period on its Sales card.
Seasonal considerations:
- Some months are naturally busier (December) or quieter (January)
- Compare like-for-like rather than sequential months
- Factor in external events (local festivals, school holidays)
Step 10: Set Goals for the Coming Month
Based on your analysis, set specific, measurable goals.
Example goal areas:
| Area | Example Goal |
|---|---|
| Revenue | Increase by 5% over last month |
| Rebooking | Improve rebook rate from 65% to 70% |
| Outstanding balances | Reduce by £500 through collection |
| New customers | Acquire 10 new customers |
| Product sales | Increase retail sales by 10% |
Make goals SMART:
- Specific - Clear and well-defined
- Measurable - Trackable in Luminate
- Achievable - Realistic given your resources
- Relevant - Aligned with business priorities
- Time-bound - Monthly deadline
Share goals with your team: When staff understand the goals, they can contribute to achieving them. Consider sharing:
- Revenue targets (in general terms)
- Rebook rate targets
- Customer service goals
- Individual performance targets
Monthly Review Checklist
Use this checklist at the start of each month:
| Task | Location | Time |
|---|---|---|
| Run and analyse Daily Revenue report | Reports > Daily Revenue | 15 min |
| Review Staff Performance | Reports > Staff Performance | 15 min |
| Check Hours Worked report | Reports > Hours Worked | 10 min |
| Process Payroll report | Reports > Payroll | 15 min |
| Review Leave Report | Reports > Leave Report | 10 min |
| Analyse Top Customers | Reports > Top Customers | 10 min |
| Check Accounts Receivable | Reports > Accounts Receivable | 10 min |
| Review Gift Voucher liability | Reports > Gift Vouchers | 10 min |
| Check SMS usage | Reports > SMS Usage | 5 min |
| Compare year-over-year | Reports (various) | 10 min |
| Set goals for next month | - | 15 min |
Total time: approximately 2 hours
Common Pitfalls
"I don't have time for a 2-hour monthly review"
You don't have to do everything in one sitting. Spread tasks across the first week of the month. The key is completing all checks before mid-month so you can act on insights.
"The numbers don't match my bank account"
Remember that Luminate tracks bookings and transactions, not bank deposits. Differences may be due to: card processing delays, cash not yet banked, refunds in progress, or timing differences.
"The same month shows different totals in different reports"
Each report answers a different question, so two of them can describe one month with two numbers and both be right. The three you'll meet in this review:
- Daily Revenue counts what customers were charged, tax included. Staff Performance counts service and product lines before tax, so its total is lower.
- Payroll counts the hours people were rostered for. Hours Worked takes approved leave off, so its hours are lower for anyone who had time off.
- The SMS Usage summary cards report your account since it opened, not the month you filtered to.
Before you chase a difference, check you're comparing the same question.
"I don't know what 'good' looks like for my metrics"
Start by tracking trends rather than absolute values. Are you improving month over month? Then build benchmarks over 6-12 months of data. Industry benchmarks are less useful than your own historical trends.
"Staff dispute their commission calculations"
The payroll report provides transparency. Walk through the calculation with the staff member: their rate, the services they provided, and how commission was calculated. This often resolves misunderstandings.
Tips and Best Practices
Create a monthly review template - Use the same format each month so comparisons are easy. Keep your monthly reports in a folder for historical reference.
Schedule the review in your calendar - Block 2 hours in the first week of each month. Treat it as an unmissable appointment.
Export and archive reports - Download key reports and save them to a secure location. This provides backup and historical data access.
Look for patterns, not just numbers - Single-month anomalies may not be significant. Three-month trends are more meaningful.
Share insights appropriately - Some data (like individual commission) should be private. Other data (like overall salon performance) can motivate the team.
Connect numbers to actions - Every insight should lead to an action or decision. If data doesn't inform action, question whether you need to track it.
Involve your accountant - Share relevant exports with your accountant for financial planning and tax purposes.
Related Tutorials
- Tutorial 9.1: Understanding Your Dashboard - Interpret key metrics
- Tutorial 9.2: Running Revenue Reports - Detailed revenue analysis
- Tutorial 9.3: Staff Performance and Commission Reports - Staff metrics
- Tutorial 9.4: Customer Analytics - Top Customers and Retention - Customer insights
- Tutorial 9.5: Accounts Receivable and Outstanding Balance Reports - Manage debts
- Tutorial 9.6: Payroll Processing and Reports - Handle payroll
- Tutorial 9.7: Staff Hours Worked Report - Rostered hours detail
- Tutorial 9.8: VAT/Tax Report - Figures for your tax return
- Tutorial 6.4: Leave Reports and Year-End Management - Leave years and carryover
- Tutorial 8.3: Gift Vouchers - Selling and Redeeming - How voucher liability builds up
- Tutorial 10.5: SMS Balance and Usage Tracking - Credits, top-ups and auto top-up
- Tutorial 17.3: Weekly Management Tasks - The weekly routine this review builds on
Frequently Asked Questions
When exactly should I run the monthly review?
Ideally, within the first week of the new month, after all previous month transactions are complete. Some salons do it on the 1st, others wait until the 5th to ensure everything is captured.
Should I share revenue figures with staff?
This depends on your business culture. Some owners share total salon revenue to create collective ownership. Others prefer keeping specifics private. You might share growth percentages without absolute numbers.
How do I track goals month-to-month?
Create a simple spreadsheet tracking each goal, actual result, and variance. Over time, this becomes valuable for understanding what's achievable and where you consistently fall short.
What if my salon is seasonal and summer months are always slow?
Year-over-year comparison is more valuable than month-to-month in seasonal businesses. Compare July this year to July last year, not July to June.
How detailed should my analysis be for a small salon?
The process is the same regardless of size, but the time might be shorter. A small salon might complete this review in an hour. The key is doing it consistently.
Last Updated: August 2026